Books, Courses & Certifications
Student Scores in Math, Science, Reading Slide Again on Nation’s Report Card

Exasperating. Depressing. Predictable.
That’s how experts describe the latest results from the National Assessment of Educational Progress, also known as the “nation’s report card.”
Considered a highly accurate window into student performance, the assessment has become a periodic reminder of declining academic success among students in the U.S., with the last several rounds accentuating yearslong slumps in learning. In January, for instance, the previous round of NAEP results revealed the biggest share of eighth graders who did not meet basic reading proficiency in the assessment’s history.
Now, the latest results, released Tuesday after a delay, showed continued decline.
Eighth graders saw the first fall in average science scores since the assessment took its current form in 2009. The assessment looked at physical science, life science, and earth and space sciences. Thirty-eight percent of students performed below basic, a level which means these students probably don’t know that plants need sunlight to grow and reproduce, according to NAEP. In contrast, only 31 percent of students performed at proficient levels.
Twelfth graders saw a three-point fall in average math and reading scores, compared to results from 2019. The exam also shows that the achievement gap between high- and low-scoring students is swelling, a major point of concern. In math, the gap is wider than it’s ever been.
But most eye-grabbing is the fact that 45 percent of high school seniors — the highest percentage ever recorded — scored below basic in math, meaning they cannot determine probabilities of simple events from two-way tables and verbal descriptions. In contrast, just 22 percent scored at-or-above proficient. In reading, 32 percent scored below basic, and 35 percent met the proficient threshold. Twelfth grade students also reported high rates of absenteeism.
Tucked inside the report was the finding that parents’ education did not appear to hold much sway on student performance in the lower quartiles, which will bear further unpacking, according to one expert’s first analysis.
But the scores contained other glum trends, as well.
For example, the gap in outcomes in the sciences between male and female students, which had narrowed in recent years, bounced back. (A similar gap in math reappeared since the pandemic, pushing educators to get creative in trying to nourish girls’ interest in the subject.)
But with teacher shortages and schools facing enrollment declines and budget shortfalls, experts say it’s not surprising that students still struggle. Those who watch education closely describe themselves as tired, exasperated and even depressed from watching a decade’s worth of student performance declines. They also express doubt that political posturing around the scores will translate into improvements.
Political Posturing
Despite a sterling reputation, the assessment found itself snagged by federal upheaval.
NAEP is a congressionally mandated program run by the National Center for Education Statistics. Since the last round of results was released, back in January, the center and the broader U.S. Department of Education have dealt with shredded contracts, mass firings and the sudden dismissal of Peggy Carr, who’d helped burnish the assessment’s reputation and statistical rigor and whose firing delayed the release of these latest results.
The country’s education system overall has also undergone significant changes, including the introduction of a national school choice plan, meant to shift public dollars to private schools, through the Republican budget.
Declining scores provide the Trump administration a potential cudgel for its dismantling of public education, and some have seized upon it: Congressman Tim Walberg, a Republican from Michigan and chairman of the House Education and Workforce Committee, blamed the latest scores on the Democrats’ “student-last policies,” in a prepared statement.
“The lesson is clear,” argued Education Secretary Linda McMahon in her comment on the latest scores. “Success isn’t about how much money we spend, but who controls the money and where that money is invested,” she wrote, stressing that students need an approach that returns control education to the states.
Some observers chortle at the “back to the states” analysis. After all, state and local governments already control most of the policies and spending related to public schools.
Regardless, experts suggest that just pushing more of education governance to the states will not solve the underlying causes of declining student performance. Declines in scores predate the pandemic, they also say.
No Real Progress
States have always been in charge of setting their own standards and assessments, says Latrenda Knighten, president of the National Council of Teachers of Mathematics. These national assessments are useful for comparing student performance across states, she adds.
Ultimately, in her view, the latest scores reveal the need for efforts to boost high-quality instruction and continuous professional learning for teachers to address systemic issues, a sentiment reflected in her organization’s public comment on the assessment. The results shine a spotlight on the need for greater opportunity in high school mathematics across the country, Knighten told EdSurge. She believes that means devoting more money for teacher training.
Some think that the causes of this academic slide are relatively well understood.
Teacher quality has declined, as teacher prep programs struggle to supply qualified teachers, particularly in math, and schools struggle to fill vacancies, says Robin Lake, director of the Center on Reinventing Public Education. She argues there has also been a decline in the desire to push schools to be accountable for poor student performance, and an inability to adapt.
There’s also confusion about which curriculum is best for students, she says. For instance, fierce debates continue to split teachers around “tracking,” where students are grouped into math paths based on perceived ability.
But will yet another poor national assessment spur change?
The results continue a decade-long decline in student performance, says Christy Hovanetz, a senior policy fellow for the nonprofit ExcelinEd.
Hovanetz worries that NAEP’s potential lessons will get “lost in the wash.” What’s needed is a balance between turning more authority back over to the states to operate education and a more robust requirement for accountability that allows states to do whatever they want, so long as they demonstrate it’s actually working, she says. That could mean requiring state assessments and accountability systems, she adds.
But right now, a lot of the states aren’t focusing on best practices for science and reading instruction, and they aren’t all requiring high-quality instructional materials, she says.
Worse, some are lowering the standards to meet poor student performance, she argues. For instance, Kansas recently altered its state testing. The changes, which involved changing score ranges, have drawn concerns from parents that the state is watering down standards. Hovanetz thinks that’s the case. In making the changes, the state joined Illinois, Wisconsin and Oklahoma in lowering expectations for students on state tests, she argues.
What’s uncontested from all perspectives is that the education system isn’t working.
“It’s truly the definition of insanity: to keep doing what we’re doing and hoping for better results,” says Lake, of the Center on Reinventing Public Education, adding: “We’re not getting them.”
Books, Courses & Certifications
Enhance video understanding with Amazon Bedrock Data Automation and open-set object detection

In real-world video and image analysis, businesses often face the challenge of detecting objects that weren’t part of a model’s original training set. This becomes especially difficult in dynamic environments where new, unknown, or user-defined objects frequently appear. For example, media publishers might want to track emerging brands or products in user-generated content; advertisers need to analyze product appearances in influencer videos despite visual variations; retail providers aim to support flexible, descriptive search; self-driving cars must identify unexpected road debris; and manufacturing systems need to catch novel or subtle defects without prior labeling.In all these cases, traditional closed-set object detection (CSOD) models—which only recognize a fixed list of predefined categories—fail to deliver. They either misclassify the unknown objects or ignore them entirely, limiting their usefulness for real-world applications.Open-set object detection (OSOD) is an approach that enables models to detect both known and previously unseen objects, including those not encountered during training. It supports flexible input prompts, ranging from specific object names to open-ended descriptions, and can adapt to user-defined targets in real time without requiring retraining. By combining visual recognition with semantic understanding—often through vision-language models—OSOD helps users query the system broadly, even if it’s unfamiliar, ambiguous, or entirely new.
In this post, we explore how Amazon Bedrock Data Automation uses OSOD to enhance video understanding.
Amazon Bedrock Data Automation and video blueprints with OSOD
Amazon Bedrock Data Automation is a cloud-based service that extracts insights from unstructured content like documents, images, video and audio. Specifically, for video content, Amazon Bedrock Data Automation supports functionalities such as chapter segmentation, frame-level text detection, chapter-level classification Interactive Advertising Bureau (IAB) taxonomies, and frame-level OSOD. For more information about Amazon Bedrock Data Automation, see Automate video insights for contextual advertising using Amazon Bedrock Data Automation.
Amazon Bedrock Data Automation video blueprints support OSOD on the frame level. You can input a video along with a text prompt specifying the desired objects to detect. For each frame, the model outputs a dictionary containing bounding boxes in XYWH format (the x and y coordinates of the top-left corner, followed by the width and height of the box), along with corresponding labels and confidence scores. You can further customize the output based on their needs—for instance, filtering by high-confidence detections when precision is prioritized.
The input text is highly flexible, so you can define dynamic fields in the Amazon Bedrock Data Automation video blueprints powered by OSOD.
Example use cases
In this section, we explore some examples of different use cases for Amazon Bedrock Data Automation video blueprints using OSOD. The following table summarizes the functionality of this feature.
| Functionality | Sub-functionality | Examples |
| Multi-granular visual comprehension | Object detection from fine-grained object reference | "Detect the apple in the video." |
| Object detection from cross-granularity object reference | "Detect all the fruit items in the image." |
|
| Object detection from open questions | "Find and detect the most visually important elements in the image." |
|
| Visual hallucination detection | Identify and flag object mentionings in the input text that do not correspond to actual content in the given image. | "Detect if apples appear in the image." |
Ads analysis
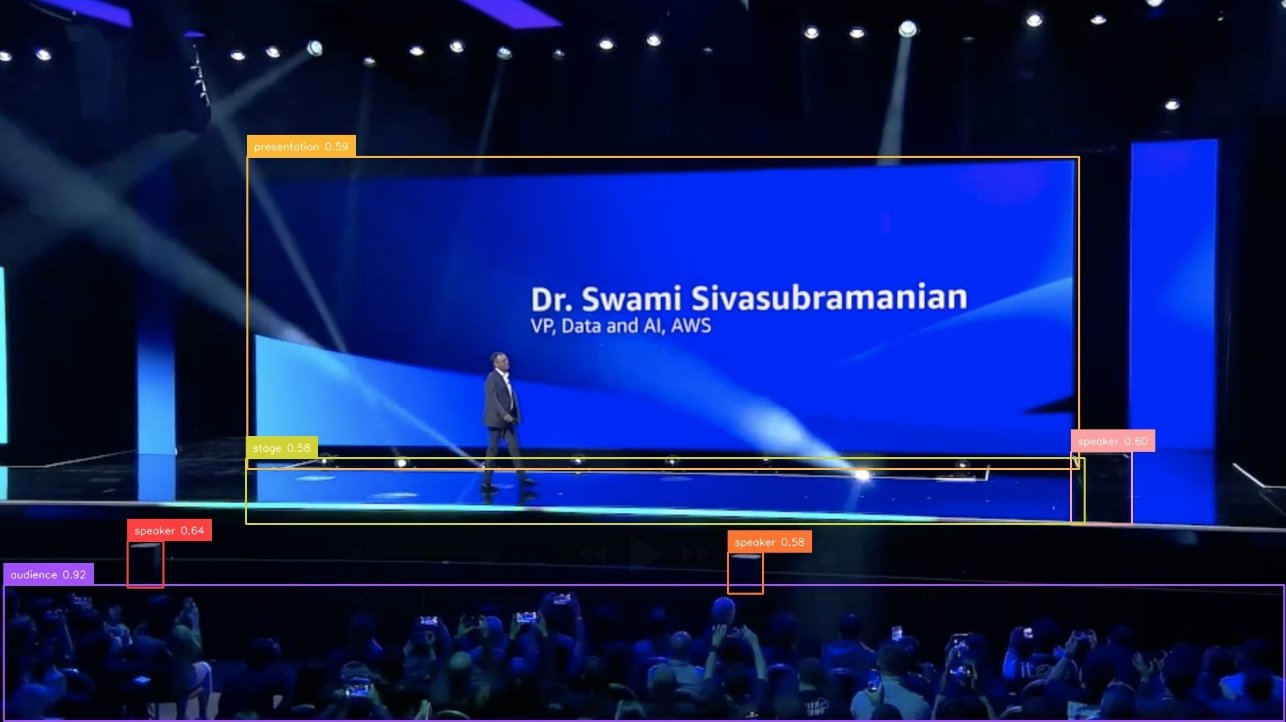
Advertisers can use this feature to compare the effectiveness of various ad placement strategies across different locations and conduct A/B testing to identify the most optimal advertising approach. For example, the following image is the output in response to the prompt “Detect the locations of echo devices.”
Smart resizing
By detecting key elements in the video, you can choose appropriate resizing strategies for devices with different resolutions and aspect ratios, making sure important visual information is preserved. For example, the following image is the output in response to the prompt “Detect the key elements in the video.”
Surveillance with intelligent monitoring
In home security systems, producers or users can take advantage of the model’s high-level understanding and localization capabilities to maintain safety, without the need to manually enumerate all possible scenarios. For example, the following image is the output in response to the prompt “Check dangerous elements in the video.”

Custom labels
You can define your own labels and search through videos to retrieve specific, desired results. For example, the following image is the output in response to the prompt “Detect the white car with red wheels in the video.”

Image and video editing
With flexible text-based object detection, you can accurately remove or replace objects in photo editing software, minimizing the need for imprecise, hand-drawn masks that often require multiple attempts to achieve the desired result. For example, the following image is the output in response to the prompt “Detect the people riding motorcycles in the video.”
Sample video blueprint input and output
The following example demonstrates how to define an Amazon Bedrock Data Automation video blueprint to detect visually prominent objects at the chapter level, with sample output including objects and their bounding boxes.
The following code is our example blueprint schema:
The following code is out example video custom output:
For the full example, refer to the following GitHub repo.
Conclusion
The OSOD capability within Amazon Bedrock Data Automation significantly enhances the ability to extract actionable insights from video content. By combining flexible text-driven queries with frame-level object localization, OSOD helps users across industries implement intelligent video analysis workflows—ranging from targeted ad evaluation and security monitoring to custom object tracking. Integrated seamlessly into the broader suite of video analysis tools available in Amazon Bedrock Data Automation, OSOD not only streamlines content understanding but also help reduce the need for manual intervention and rigid pre-defined schemas, making it a powerful asset for scalable, real-world applications.
To learn more about Amazon Bedrock Data Automation video and audio analysis, see New Amazon Bedrock Data Automation capabilities streamline video and audio analysis.
About the authors
 Dongsheng An is an Applied Scientist at AWS AI, specializing in face recognition, open-set object detection, and vision-language models. He received his Ph.D. in Computer Science from Stony Brook University, focusing on optimal transport and generative modeling.
 Lana Zhang is a Senior Solutions Architect in the AWS World Wide Specialist Organization AI Services team, specializing in AI and generative AI with a focus on use cases including content moderation and media analysis. She’s dedicated to promoting AWS AI and generative AI solutions, demonstrating how generative AI can transform classic use cases by adding business value. She assists customers in transforming their business solutions across diverse industries, including social media, gaming, ecommerce, media, advertising, and marketing.
 Raj Jayaraman is a Senior Generative AI Solutions Architect at AWS, bringing over a decade of experience in helping customers extract valuable insights from data. Specializing in AWS AI and generative AI solutions, Raj’s expertise lies in transforming business solutions through the strategic application of AWS’s AI capabilities, ensuring customers can harness the full potential of generative AI in their unique contexts. With a strong background in guiding customers across industries in adopting AWS Analytics and Business Intelligence services, Raj now focuses on assisting organizations in their generative AI journey—from initial demonstrations to proof of concepts and ultimately to production implementations.
Books, Courses & Certifications
How Skello uses Amazon Bedrock to query data in a multi-tenant environment while keeping logical boundaries
This is a guest post co-written with Skello.
Skello is a leading human resources (HR) software as a service (SaaS) solution focusing on employee scheduling and workforce management. Catering to diverse sectors such as hospitality, retail, healthcare, construction, and industry, Skello offers features including schedule creation, time tracking, and payroll preparation. With approximately 20,000 customers and 400,000 daily users across Europe as of 2024, Skello continually innovates to meet its clients’ evolving needs.
One such innovation is the implementation of an AI-powered assistant to enhance user experience and data accessibility. In this post, we explain how Skello used Amazon Bedrock to create this AI assistant for end-users while maintaining customer data safety in a multi-tenant environment. Amazon Bedrock is a fully managed service that offers a choice of high-performing foundation models (FMs) through a single API, along with a broad set of capabilities to build generative AI applications with security, privacy, and responsible AI.
We dive deep into the challenges of implementing large language models (LLMs) for data querying, particularly in the context of a French company operating under the General Data Protection Regulation (GDPR). Our solution demonstrates how to balance powerful AI capabilities with strict data protection requirements.
Challenges with multi-tenant data access
As Skello’s platform grew to serve thousands of businesses, we identified a critical need: our users needed better ways to access and understand their workforce data. Many of our customers, particularly those in HR and operations roles, found traditional database querying tools too technical and time-consuming. This led us to identify two key areas for improvement:
- Quick access to non-structured data – Our users needed to find specific information across various data types—employee records, scheduling data, attendance logs, and performance metrics. Traditional search methods often fell short when users had complex questions like “Show me all part-time employees who worked more than 30 hours last month” or “What’s the average sick leave duration in the retail department?”
- Visualization of data through graphs for analytics – Although our platform collected comprehensive workforce data, users struggled to transform this raw information into actionable insights. They needed an intuitive way to create visual representations of trends and patterns without writing complex SQL queries or learning specialized business intelligence tools.
To address these challenges, we needed a solution that could:
- Understand natural language questions about complex workforce data
- Correctly interpret context and intent from user queries
- Generate appropriate database queries while respecting data access rules
- Return results in user-friendly formats, including visualizations
- Handle variations in how users might phrase similar questions
- Process queries about time-based data and trends
LLMs emerged as the ideal solution for this task. Their ability to understand natural language and context, combined with their capability to generate structured outputs, made them perfectly suited for translating user questions into precise database queries. However, implementing LLMs in a business-critical application required careful consideration of security, accuracy, and performance requirements.
Solution overview
Using LLMs to generate structured queries from natural language input is an emerging area of interest. This process enables the transformation of user requests into organized data structures, which can then be used to query databases automatically.
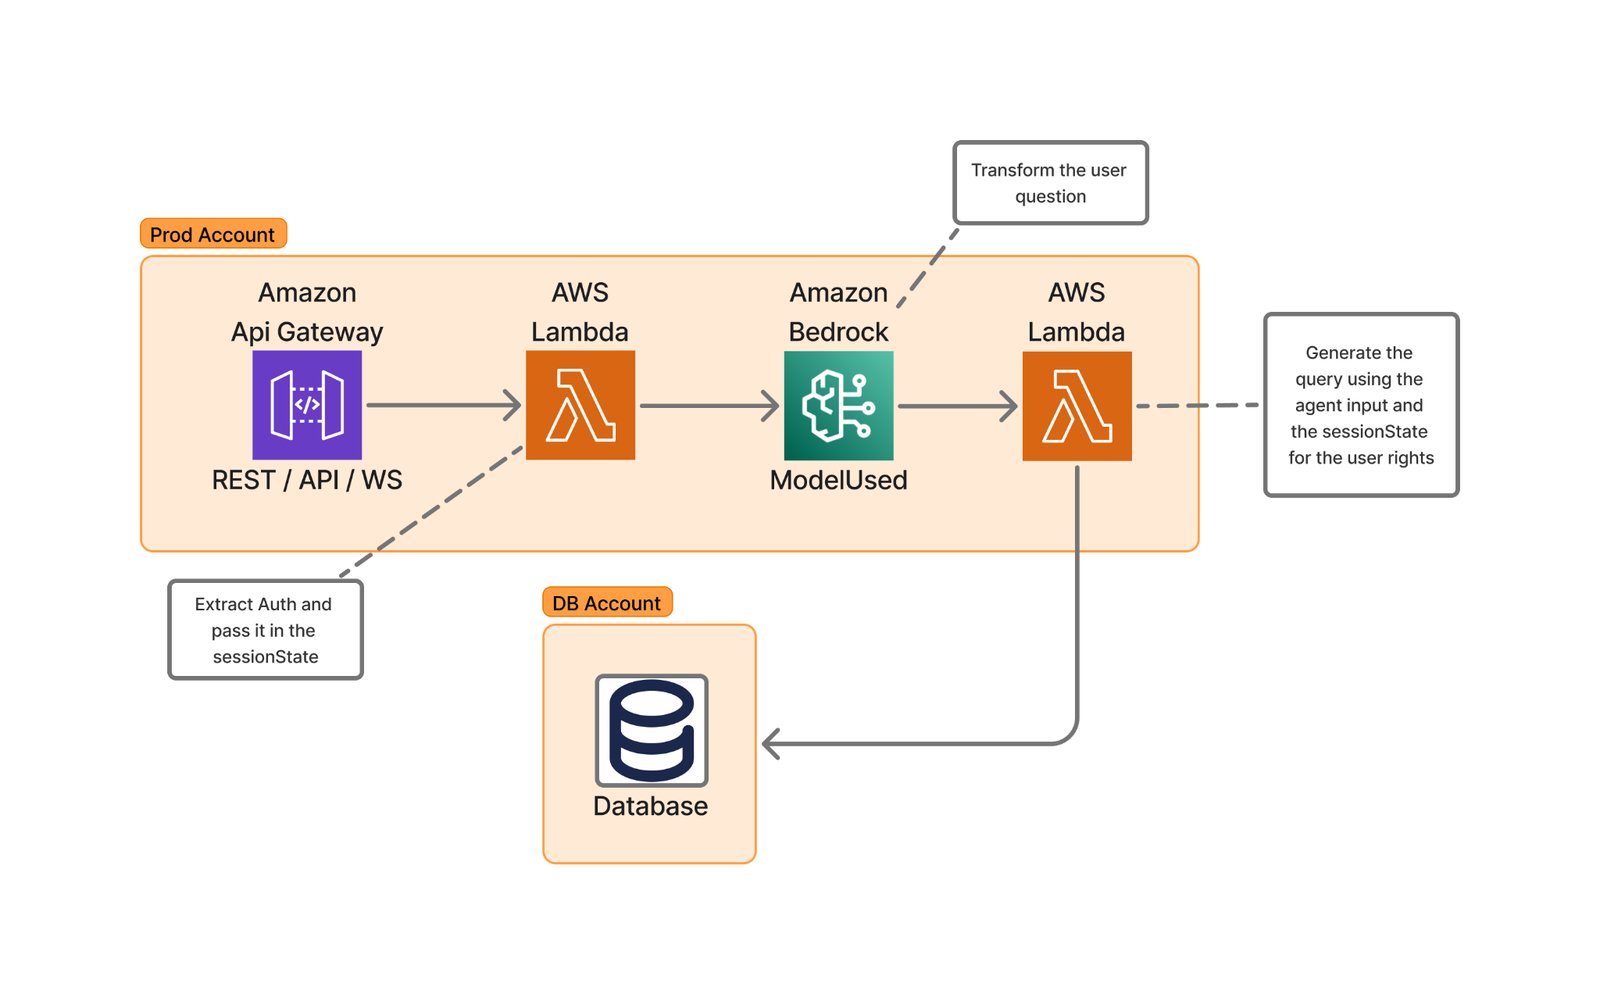
The following diagram of Skello’s high-level architecture illustrates this user request transformation process.
The implementation using AWS Lambda and Amazon Bedrock provides several advantages:
- Scalability through serverless architecture
- Cost-effective processing with pay-as-you-go pricing
- Low-latency performance
- Access to advanced language models like Anthropic’s Claude 3.5 Sonnet
- Rapid deployment capabilities
- Flexible integration options
Basic query generation process
The following diagram illustrates how we transform natural language queries into structured database requests. For this example, the user asks “Give me the gender parity.”
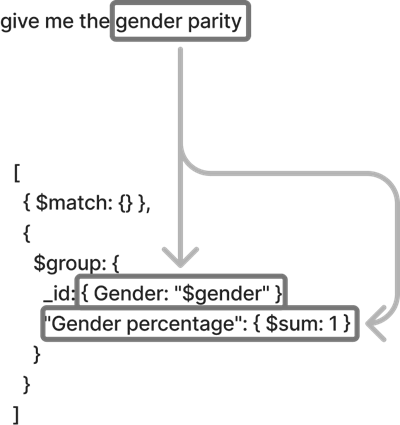
The process works as follows:
- The authentication service validates the user’s identity and permissions.
- The LLM converts the natural language to a structured query format.
- The query validation service enforces compliance with security policies.
- The database access layer executes the query within the user’s permitted scope.
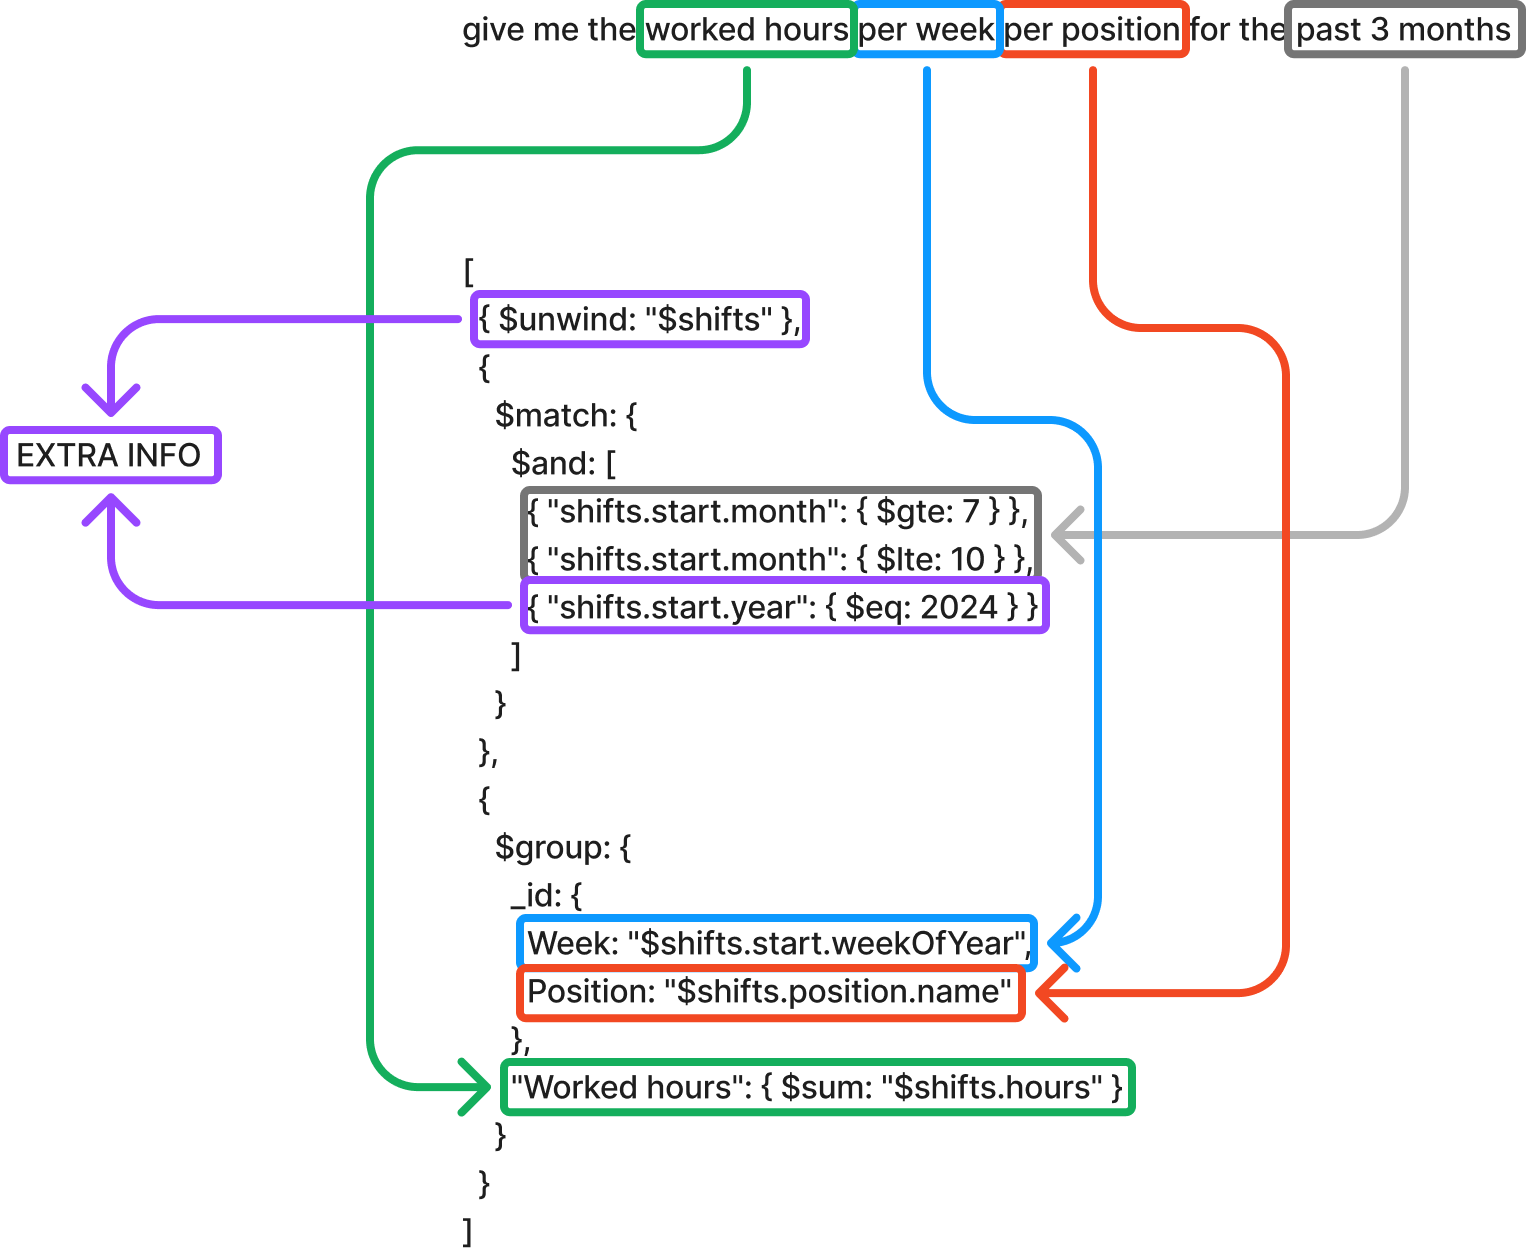
Handling complex queries
For more sophisticated requests like “Give me the worked hours per week per position for the last 3 months,” our system completes the following steps:
- Extract query components:
- Target metric: worked hours
- Aggregation levels: week, position
- Time frame: 3 months
- Generate temporal calculations:
- Use relative time expressions instead of hard-coded dates
- Implement standardized date handling patterns
Data schema optimization
To make our system as efficient and user-friendly as possible, we carefully organized our data structure—think of it as creating a well-organized filing system for a large office.
We created standardized schema definitions, establishing consistent ways to store similar types of information. For example, date-related fields (hire dates, shift times, vacation periods) follow the same format. This helps prevent confusion when users ask questions like “Show me all events from last week.” It’s similar to having all calendars in your office using the same date format instead of some using MM/DD/YY and others using DD/MM/YY.
Our system employs consistent naming conventions with clear, predictable names for all data fields. Instead of technical abbreviations like emp_typ_cd, we use clear terms like employee_type. This makes it straightforward for the AI to understand what users mean when they ask questions like “Show me all full-time employees.”
For optimized search patterns, we strategically organized our data to make common searches fast and efficient. This is particularly important because it directly impacts user experience and system performance. We analyzed usage patterns to identify the most frequently requested information and designed our database indexes accordingly. Additionally, we created specialized data views that pre-aggregate common report requests. This comprehensive approach means questions like “Who’s working today?” get answered almost instantly.
We also established clear data relationships by mapping out how different pieces of information relate to each other. For example, we clearly connect employees to their departments, shifts, and managers. This helps answer complex questions like “Show me all department managers who have team members on vacation next week.”
These optimizations deliver real benefits to our users:
- Faster response times when asking questions
- More accurate answers to queries
- Less confusion when referring to specific types of data
- Ability to ask more complex questions about relationships between different types of information
- Consistent results when asking similar questions in different ways
For example, whether a user asks “Show me everyone’s vacation time” or “Display all holiday schedules,” the system understands they’re looking for the same type of information. This reliability makes the system more trustworthy and easier to use for everyone, regardless of their technical background.
Graph generation and display
One of the most powerful features of our system is its ability to turn data into meaningful visual charts and graphs automatically. This consists of the following actions:
- Smart label creation – The system understands what your data means and creates clear, readable labels. For example, if you ask “Show me employee attendance over the last 6 months,” the horizontal axis automatically labels the months (January through June), the vertical axis shows attendance numbers with simple-to-read intervals, and the title clearly states what you’re looking at: “Employee Attendance Trends.”
- Automatic legend creation – The system creates helpful legends that explain what each part of the chart means. For instance, if you ask “Compare sales across different departments,” different departments get different colors, a clear legend shows which color represents which department, and additional information like “Dashed lines show previous year” is automatically added when needed.
- Choosing the right type of chart – The system is smart about picking the best way to show your information. For example, it uses bar charts for comparing different categories (“Show me sales by department”), line graphs for trends over time (“How has attendance changed this year?”), pie charts for showing parts of a whole (“What’s the breakdown of full-time vs. part-time staff?”), and heat maps for complex patterns (“Show me busiest hours per day of the week”).
- Smart sizing and scaling – The system automatically adjusts the size and scale of charts to make them simple to read. For example, if numbers range from 1–100, it might show intervals of 10; if you’re looking at millions, it might show them in a more readable way (1M, 2M, etc.); charts automatically resize to show patterns clearly; and important details are never too small to see.
All of this happens automatically—you ask your question, and the system handles the technical details of creating a clear, professional visualization. For example, the following figure is an example for the question “How many hours my employees worked over the past 7 weeks?”

Security-first architecture
Our implementation adheres to OWASP best practices (specifically LLM06) by maintaining complete separation between security controls and the LLM.
Through dedicated security services, user authentication and authorization checks are performed before LLM interactions, with user context and permissions managed through Amazon Bedrock SessionParameters, keeping security information entirely outside of LLM processing.
Our validation layer uses Amazon Bedrock Guardrails to protect against prompt injection, inappropriate content, and forbidden topics such as racism, sexism, or illegal content.
The system’s architecture implements strict role-based access controls through a detailed permissions matrix, so users can only access data within their authorized scope. For authentication, we use industry-standard JWT and SAML protocols, and our authorization service maintains granular control over data access permissions.
This multi-layered approach prevents potential security bypasses through prompt manipulation or other LLM-specific attacks. The system automatically enforces data boundaries at both database and API levels, effectively preventing cross-contamination between different customer accounts. For instance, department managers can only access their team’s data, with these restrictions enforced through database compartmentalization.
Additionally, our comprehensive audit system maintains immutable logs of all actions, including timestamps, user identifiers, and accessed resources, stored separately to protect their integrity. This security framework operates seamlessly in the background, maintaining robust protection of sensitive information without disrupting the user experience or legitimate workflows.
Benefits
Creating data visualizations has never been more accessible. Even without specialized expertise, you can now produce professional-quality charts that communicate your insights effectively. The streamlined process makes sure your visualizations remain consistently clear and intuitive, so you can concentrate on exploring your data questions instead of spending time on presentation details.
The solution works through simple conversational requests that require no technical knowledge or specialized software. You simply describe what you want to visualize using everyday language and the system interprets your request and creates the appropriate visualization. There’s no need to learn complex software interfaces, remember specific commands, or understand data formatting requirements. The underlying technology handles the data processing, chart selection, and professional formatting automatically, transforming your spoken or written requests into polished visual presentations within moments.
Your specific information needs to drive how the data is displayed, making the insights more relevant and actionable. When it’s time to share your findings, these visualizations seamlessly integrate into your reports and presentations with polished formatting that enhances your overall message. This democratization of data visualization empowers everyone to tell compelling data stories.
Conclusion
In this post, we explored Skello’s implementation of an AI-powered assistant using Amazon Bedrock and Lambda. We saw how end-users can query their own data in a multi-tenant environment while maintaining logical boundaries and complying with GDPR regulations. The combination of serverless architecture and advanced language models proved effective in enhancing data accessibility and user experience.
We invite you to explore the AWS Machine Learning Blog for more insights on AI solutions and their potential business applications. If you’re interested in learning more about Skello’s journey in modernizing HR software, check out our blog post series on the topic.
If you have any questions or suggestions about implementing similar solutions in your own multi-tenant environment, please feel free to share them in the comments section.
About the authors
 Nicolas de Place is a Data & AI Solutions Architect specializing in machine learning strategy for high-growth startups. He empowers emerging companies to harness the full potential of artificial intelligence and advanced analytics, designing scalable ML architectures and data-driven solutions
 Cédric Peruzzi is a Software Architect at Skello, where he focuses on designing and implementing Generative AI features. Before his current role, he worked as a software engineer and architect, bringing his experience to help build better software solutions.
Books, Courses & Certifications
Create a private workforce on Amazon SageMaker Ground Truth with the AWS CDK
Private workforces for Amazon SageMaker Ground Truth and Amazon Augmented AI (Amazon A2I) help organizations build proprietary, high-quality datasets while keeping high standards of security and privacy.
The AWS Management Console provides a fast and intuitive way to create a private workforce, but many organizations need to automate their infrastructure deployment through infrastructure as code (IaC) because it provides benefits such as automated and consistent deployments, increased operational efficiency, and reduced chances of human errors or misconfigurations.
However, creating a private workforce with IaC is not a straightforward task because of some complex technical dependencies between services during the initial creation.
In this post, we present a complete solution for programmatically creating private workforces on Amazon SageMaker AI using the AWS Cloud Development Kit (AWS CDK), including the setup of a dedicated, fully configured Amazon Cognito user pool. The accompanying GitHub repository provides a customizable AWS CDK example that shows how to create and manage a private workforce, paired with a dedicated Amazon Cognito user pool, and how to integrate the necessary Amazon Cognito configurations.
Solution overview
This solution demonstrates how to create a private workforce and a coupled Amazon Cognito user pool and its dependent resources. The goal is to provide a comprehensive setup for the base infrastructure to enable machine learning (ML) labeling tasks.
The key technical challenge in this solution is the mutual dependency between the Amazon Cognito resources and the private workforce.
Specifically, the creation of the user pool app client requires certain parameters, such as the callback URL, which is only available after the private workforce is created. However, the private workforce creation itself needs the app client to be already present. This mutual dependency makes it challenging to set up the infrastructure in a straightforward manner.
Additionally, the user pool domain name must remain consistent across deployments, because it can’t be easily changed after the initial creation and inconsistency in the name can lead to deployment errors.
To address these challenges, the solution uses several AWS CDK constructs, including AWS CloudFormation custom resources. This custom approach allows the orchestration of the user pool and SageMaker private workforce creation, to correctly configure the resources and manage their interdependencies.
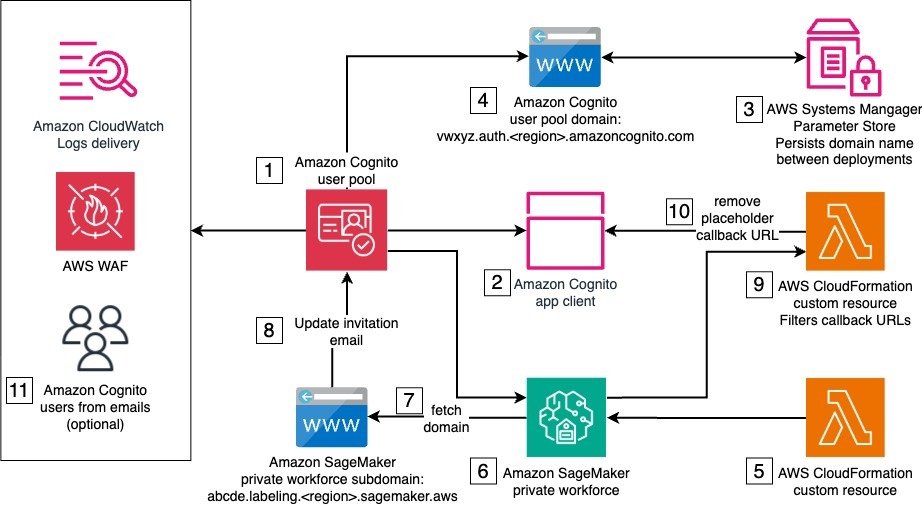
The solution architecture is composed of one stack with several resources and services, some of which are needed only for the initial setup of the private workforce, and some that are used by the private workforce workers when logging in to complete a labeling task. The following diagram illustrates this architecture.
The solution’s deployment requires AWS services and resources that work together to set up the private workforce. The numbers in the diagram reflect the stack components that support the stack creation, which occur in the following order:
- Amazon Cognito user pool – The user pool provides user management and authentication for the SageMaker private workforce. It handles user registration, login, and password management. A default email invitation is initially set to onboard new users to the private workforce. The user pool is both associated with an AWS WAF firewall and configured to deliver user activity logs to Amazon CloudWatch for enhanced security.
- Amazon Cognito user pool app client – The user pool app client configures the client application that will interact with the user pool. During the initial deployment, a temporary placeholder callback URL is used, because the actual callback URL can only be determined later in the process.
- AWS Systems Manager Parameter Store – Parameter Store, a capability of AWS Systems Manager, stores and persists the prefix of the user pool domain across deployments in a string parameter. The provided prefix must be such that the resulting domain is globally unique.
- Amazon Cognito user pool domain – The user pool domain defines the domain name for the managed login experience provided by the user pool. This domain name must remain consistent across deployments, because it can’t be easily changed after the initial creation.
- IAM roles – AWS Identity and Access Management (IAM) roles for CloudFormation custom resources include permissions to make AWS SDK calls to create the private workforce and other API calls during the next steps.
- Private workforce – Implemented using a custom resource backing the CreateWorkforce API call, the private workforce is the foundation to manage labeling activities. It creates the labeling portal and manages portal-level access controls, including authentication through the integrated user pool. Upon creation, the labeling portal URL is made available to be used as a callback URL by the Amazon Cognito app client. The connected Amazon Cognito app client is automatically updated with the new callback URL.
- SDK call to fetch the labeling portal domain – This SDK call reads the subdomain of labeling portal. This is implemented as a CloudFormation custom resource.
- SDK call to update user pool – This SDK call updates the user pool with a user invitation email that points to the labeling portal URL. This is implemented as a CloudFormation custom resource.
- Filter for placeholder callback URL – Custom logic separates the placeholder URL from the app client’s callback URLs. This is implemented as a CloudFormation custom resource, backed by a custom AWS Lambda function.
- SDK call to update the app client to remove the placeholder callback URL – This SDK call updates the app client with the correct callback URLs. This is implemented as a CloudFormation custom resource.
- User creation and invitation emails – Amazon Cognito users are created and sent invitation emails with instructions to join the private workforce.
After this initial setup, a worker can join the private workforce and access the labeling. The authentication flow includes the email invitation, initial registration, authentication, and login to the labeling portal. The following diagram illustrates this workflow.
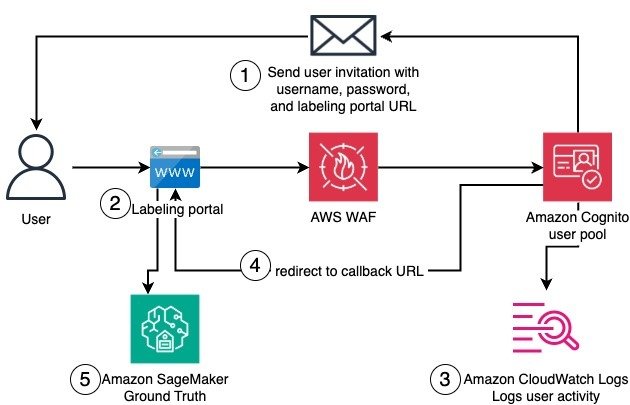
The detailed workflow steps are as follows:
- A worker receives an email invitation that provides the user name, temporary password, and URL of the labeling portal.
- When trying to reach the labeling portal, the worker is redirected to the Amazon Cognito user pool domain for authentication. Amazon Cognito domain endpoints are additionally protected by AWS WAF. The worker then sets a new password and registers with multi-factor authentication.
- Authentication actions by the worker are logged and sent to CloudWatch.
- The worker can log in and is redirected to the labeling portal.
- In the labeling portal, the worker can access existing labeling jobs in SageMaker Ground Truth.
The solution uses a mix of AWS CDK constructs and CloudFormation custom resources to integrate the Amazon Cognito user pool and the SageMaker private workforce so workers can register and access the labeling portal. In the following sections, we show how to deploy the solution.
Prerequisites
You must have the following prerequisites:
Deploy the solution
To deploy the solution, complete the following steps. Make sure you have AWS credentials available in your environment with sufficient permissions to deploy the solution resources.
- Clone the GitHub repository.
- Follow the detailed instructions in the README file to deploy the stack using the AWS CDK and AWS CLI.
- Open the AWS CloudFormation console and choose the
Workforcestack for more information on the ongoing deployment and the created resources.
Test the solution
If you invited yourself from the AWS CDK CLI to join the private workforce, follow the instructions in the email that you received to register and access the labeling portal. Otherwise, complete the following steps to invite yourself and others to join the private workforce. For more information, see Creating a new user in the AWS Management Console.
- On the Amazon Cognito console, choose User pools in the navigation pane.
- Choose the existing user pool,
MyWorkforceUserPool. - Choose Users, then choose Create a user.
- Choose Email as the alias attribute to sign in.
- Choose Send an email invitation as the invitation message.
- For User name, enter a name for the new user. Make sure not to use the email address.
- For Email address, enter the email address of the worker to be invited.
- For simplicity, choose Generate a password for the user.
- Choose Create.
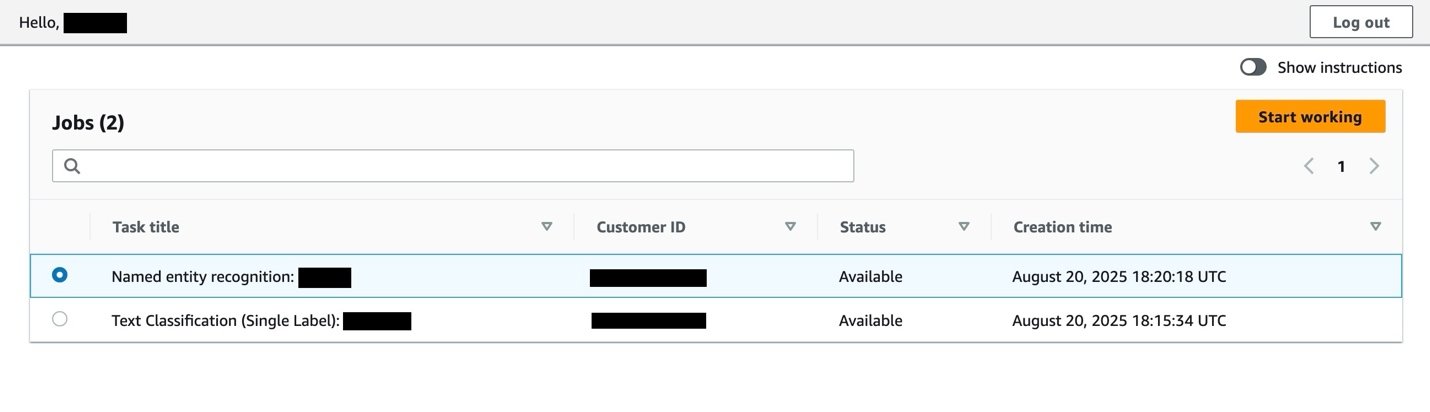
After you receive the invitation email, follow the instructions to set a new password and register with an authenticator application. Then you can log in and see a page listing your labeling jobs.
Best practices and considerations
When setting up a private workforce, consider the best practices for Amazon Cognito and the AWS CDK, as well as additional customizations:
- Customized domain – Provide your own prefix for the Amazon Cognito subdomain when deploying the solution. This way, you can use a more recognizable domain name for the labeling application, rather than a randomly generated one. For even greater customization, integrate the user pool with a custom domain that you own. This gives you full control over the URL used for the login and aligns it with the rest your organization’s applications.
- Enhance security controls – Depending on your organization’s security and compliance requirements, you can further adapt the Amazon Cognito resources, for instance, by integrating with external identity providers and following other security best practices.
- Implement VPC configuration – You can implement additional security controls, such as adding a virtual private cloud (VPC) configuration to the private workforce. This helps you enhance the overall security posture of your solution, providing an additional layer of network-level security and isolation.
- Restrict the source IPs – When creating the SageMaker private workforce, you can specify a list of IP addresses ranges (CIDR) from which workers can log in.
- AWS WAF customization – Bring your own existing AWS WAF or configure one to your organization’s needs by setting up custom rules, IP filtering, rate-based rules, and web access control lists (ACLs) to protect your application.
- Integrate with CI/CD – Incorporate the IaC in a continuous integration and continuous delivery (CI/CD) pipeline to standardize deployment, track changes, and further improve resource tracking and observability also across multiple environments (for instance, development, staging, production).
- Extend the solution – Depending on your specific use case, you might want to extend the solution to include the creation and management of work teams and labeling jobs or flows. This can help integrate the private workforce setup more seamlessly with your existing ML workflows and data labeling processes.
- Integrate with additional AWS services – To suit your specific requirements, you can further integrate the private workforce and user pool with other relevant AWS services, such as CloudWatch for logging, monitoring, and alarms, and Amazon Simple Notification Service (Amazon SNS) for notifications to enhance the capabilities of your data labeling solution.
Clean up
To clean up your resources, open the AWS CloudFormation console and delete the Workforce stack. Alternatively, if you deployed using the AWS CDK CLI, you can run cdk destroy from the same terminal where you ran cdk deploy and use the same AWS CDK CLI arguments as during deployment.
Conclusion
This solution demonstrates how to programmatically create a private workforce on SageMaker Ground Truth, paired with a dedicated and fully configured Amazon Cognito user pool. By using the AWS CDK and AWS CloudFormation, this solution brings the benefits of IaC to the setup of your ML data labeling private workforce.
To further customize this solution to meet your organization’s standards, discover how to accelerate your journey on the cloud with the help of AWS Professional Services.
We encourage you to learn more from the developer guides on data labeling on SageMaker and Amazon Cognito user pools. Refer to the following blog posts for more examples of labeling data using SageMaker Ground Truth:
About the author
 Dr. Giorgio Pessot is a Machine Learning Engineer at Amazon Web Services Professional Services. With a background in computational physics, he specializes in architecting enterprise-grade AI systems at the confluence of mathematical theory, DevOps, and cloud technologies, where technology and organizational processes converge to achieve business objectives. When he’s not whipping up cloud solutions, you’ll find Giorgio engineering culinary creations in his kitchen.
-

 Business2 weeks ago
The Guardian view on Trump and the Fed: independence is no substitute for accountability | Editorial
-
Tools & Platforms1 month ago
Building Trust in Military AI Starts with Opening the Black Box – War on the Rocks
-

 Ethics & Policy2 months ago
SDAIA Supports Saudi Arabia’s Leadership in Shaping Global AI Ethics, Policy, and Research – وكالة الأنباء السعودية
-

 Events & Conferences4 months ago
Journey to 1000 models: Scaling Instagram’s recommendation system
-

 Jobs & Careers2 months ago
Mumbai-based Perplexity Alternative Has 60k+ Users Without Funding
-

 Podcasts & Talks2 months ago
Happy 4th of July! 🎆 Made with Veo 3 in Gemini
-

 Education2 months ago
VEX Robotics launches AI-powered classroom robotics system
-

 Education2 months ago
Macron says UK and France have duty to tackle illegal migration ‘with humanity, solidarity and firmness’ – UK politics live | Politics
-

 Funding & Business2 months ago
Kayak and Expedia race to build AI travel agents that turn social posts into itineraries
-

 Podcasts & Talks2 months ago
OpenAI 🤝 @teamganassi