Jobs & Careers
Leveraging Pandas and SQL Together for Efficient Data Analysis
 Image by Author | Canva
Pandas and SQL are both effective for data analysis, but what if we could merge their power? With pandasql, you can write SQL queries directly within a Jupyter notebook. This integration seamlessly enables us to blend SQL logic with Python for effective data analysis.
In this article, we will use both pandas and SQL together on a data project from Uber. Let’s get started!
# What Is pandasql?
Pandasql can be integrated with any DataFrame through an in-memory SQLite engine, so you can write pure SQL inside a Python environment.
# Advantages of Using Pandas and SQL Together
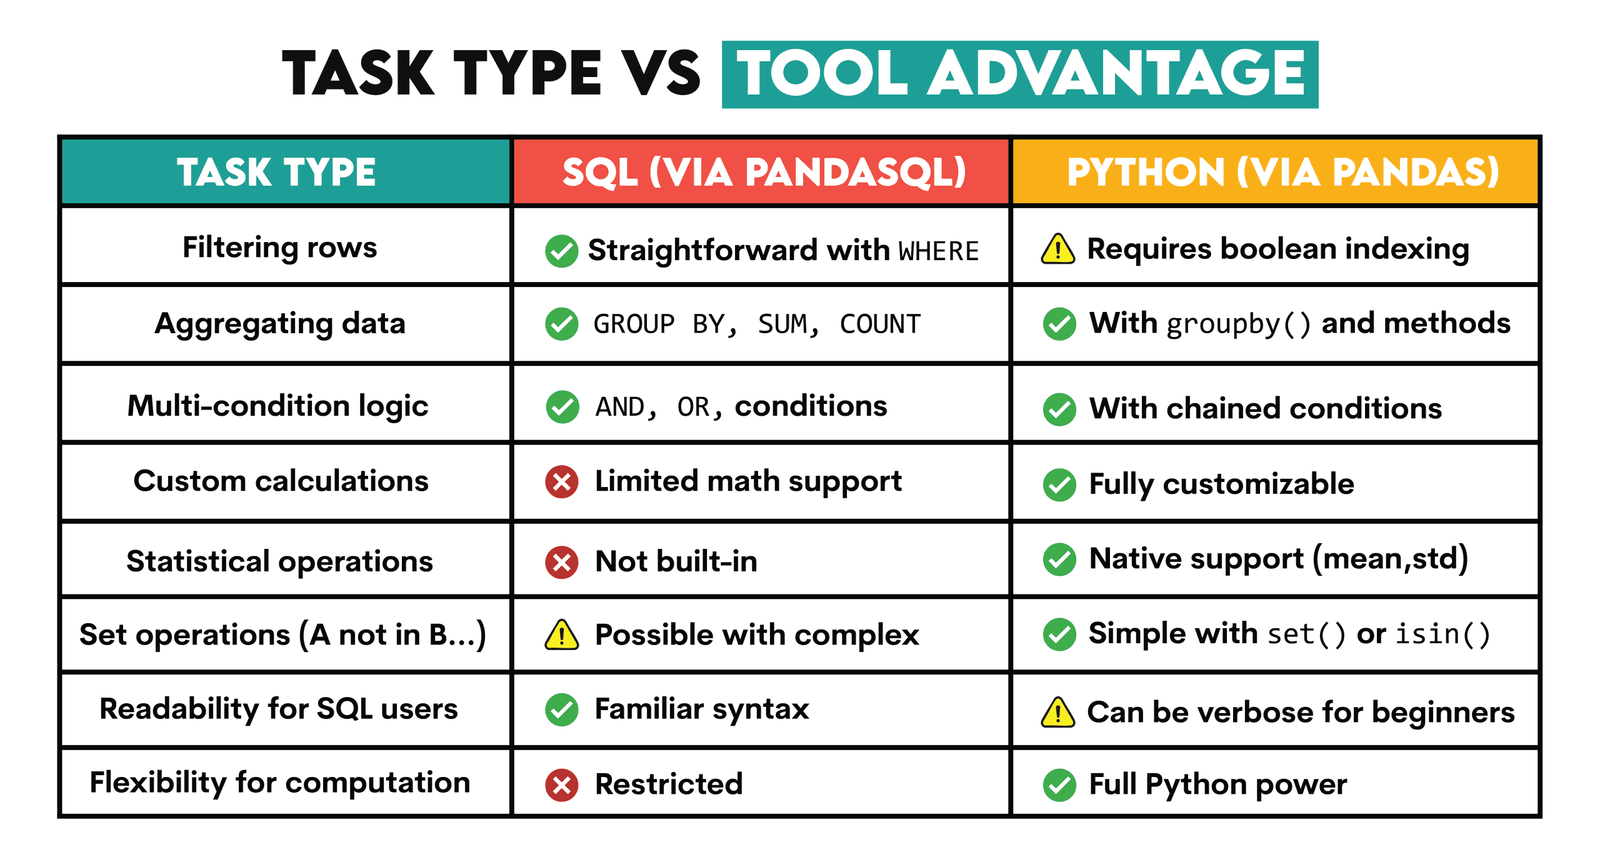

SQL is useful for easily filtering rows, aggregating data, or applying multi-condition logic.
Python, on the other hand, offers advanced tools for statistical analysis and custom computations, as well as set-based operations, which extend beyond SQL’s capabilities.
When used together, SQL simplifies data selection, while Python adds analytical flexibility.
# How to Run pandasql Inside a Jupyter Notebook?
To run pandasql inside a Jupyter Notebook, start with the following code.
import pandas as pd
from pandasql import sqldf
run = lambda q: sqldf(q, globals())
Next, you can run your SQL code like this:
run("""
SELECT *
FROM df
LIMIT 10;
""")
We will use the SQL code without showing the run function each time in this article.


Let’s see how using SQL and Pandas together works in a real-life project from Uber.
# Real-World Project: Analyzing Uber Driver Performance Data
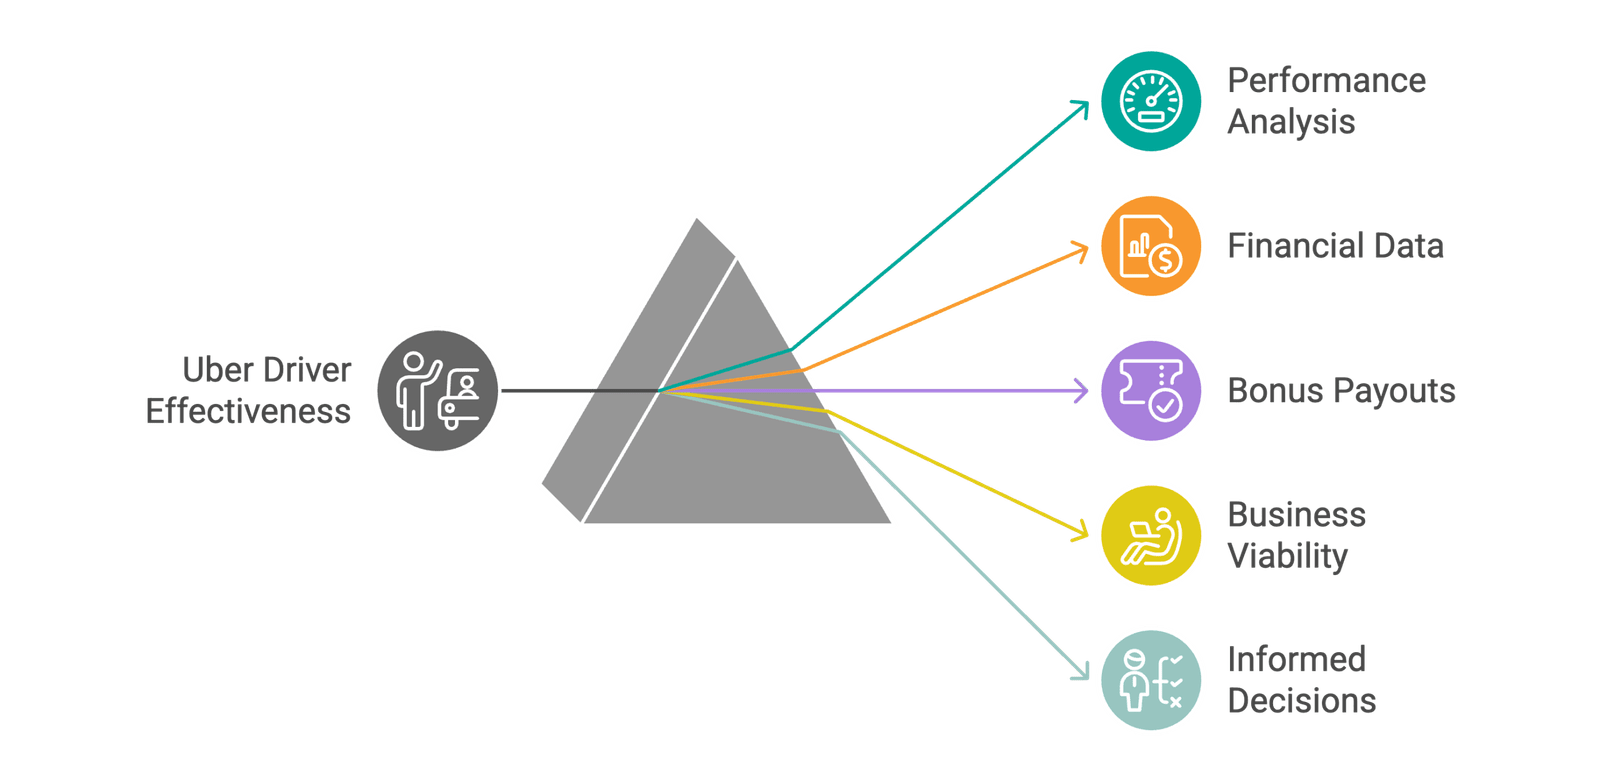

Image by Author
In this data project, Uber asks us to analyze driver performance data and evaluate bonus strategies.
// Data Exploration and Analytics
Now, let’s explore the datasets. First, we will load the data.
// Initial Dataset Loading
Let’s load the dataset by using just pandas.
import pandas as pd
import numpy as np
df = pd.read_csv('dataset_2.csv')
// Exploring the Data
Now let’s review the dataset.
The output looks like this:
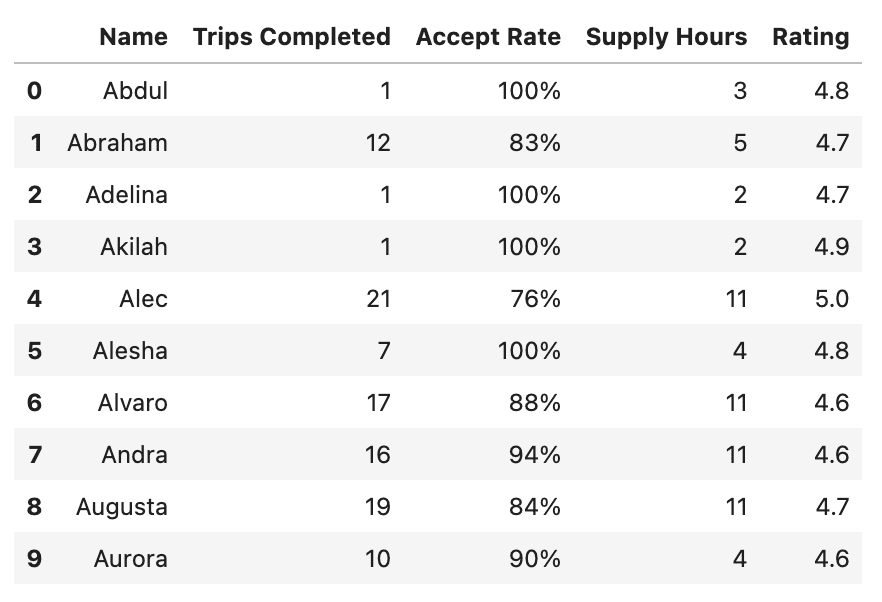

Now we have a glimpse of the data.
As you can see, the dataset includes each driver’s name, the number of trips they completed, their acceptance rate (i.e., the percentage of trip requests accepted), total supply hours (the total hours spent online), and their average rating.
Let’s verify the column names before starting the data analysis so we can use them correctly.
Here is the output.


As you can see, our dataset has five different columns, and there are no missing values.
Let’s now answer the questions using both SQL and Python.
# Question 1: Who Qualifies for Bonus Option 1?
In the first question, we are asked to determine the total bonus payout for Option 1, which is:
$50 for each driver that is online at least 8 hours, accepts 90% of requests, completes 10 trips, and has a rating of 4.7 or better during the time frame.
// Step 1: Filtering the Qualifying Drivers with SQL (pandasql)
In this step, we will start using pandasql.
In the following code, we have selected all drivers who meet the conditions for the Option 1 bonus using the WHERE clause and the AND operator for linking multiple conditions. To learn how to use WHERE and AND, refer to this documentation.
opt1_eligible = run("""
    SELECT Name                -- keep only a name column for clarity
    FROM   df
    WHERE  `Supply Hours`    >=  8
      AND  `Trips Completed` >= 10
      AND  `Accept Rate`     >= 90
      AND  Rating            >= 4.7;
""")
opt1_eligible
Here is the output.
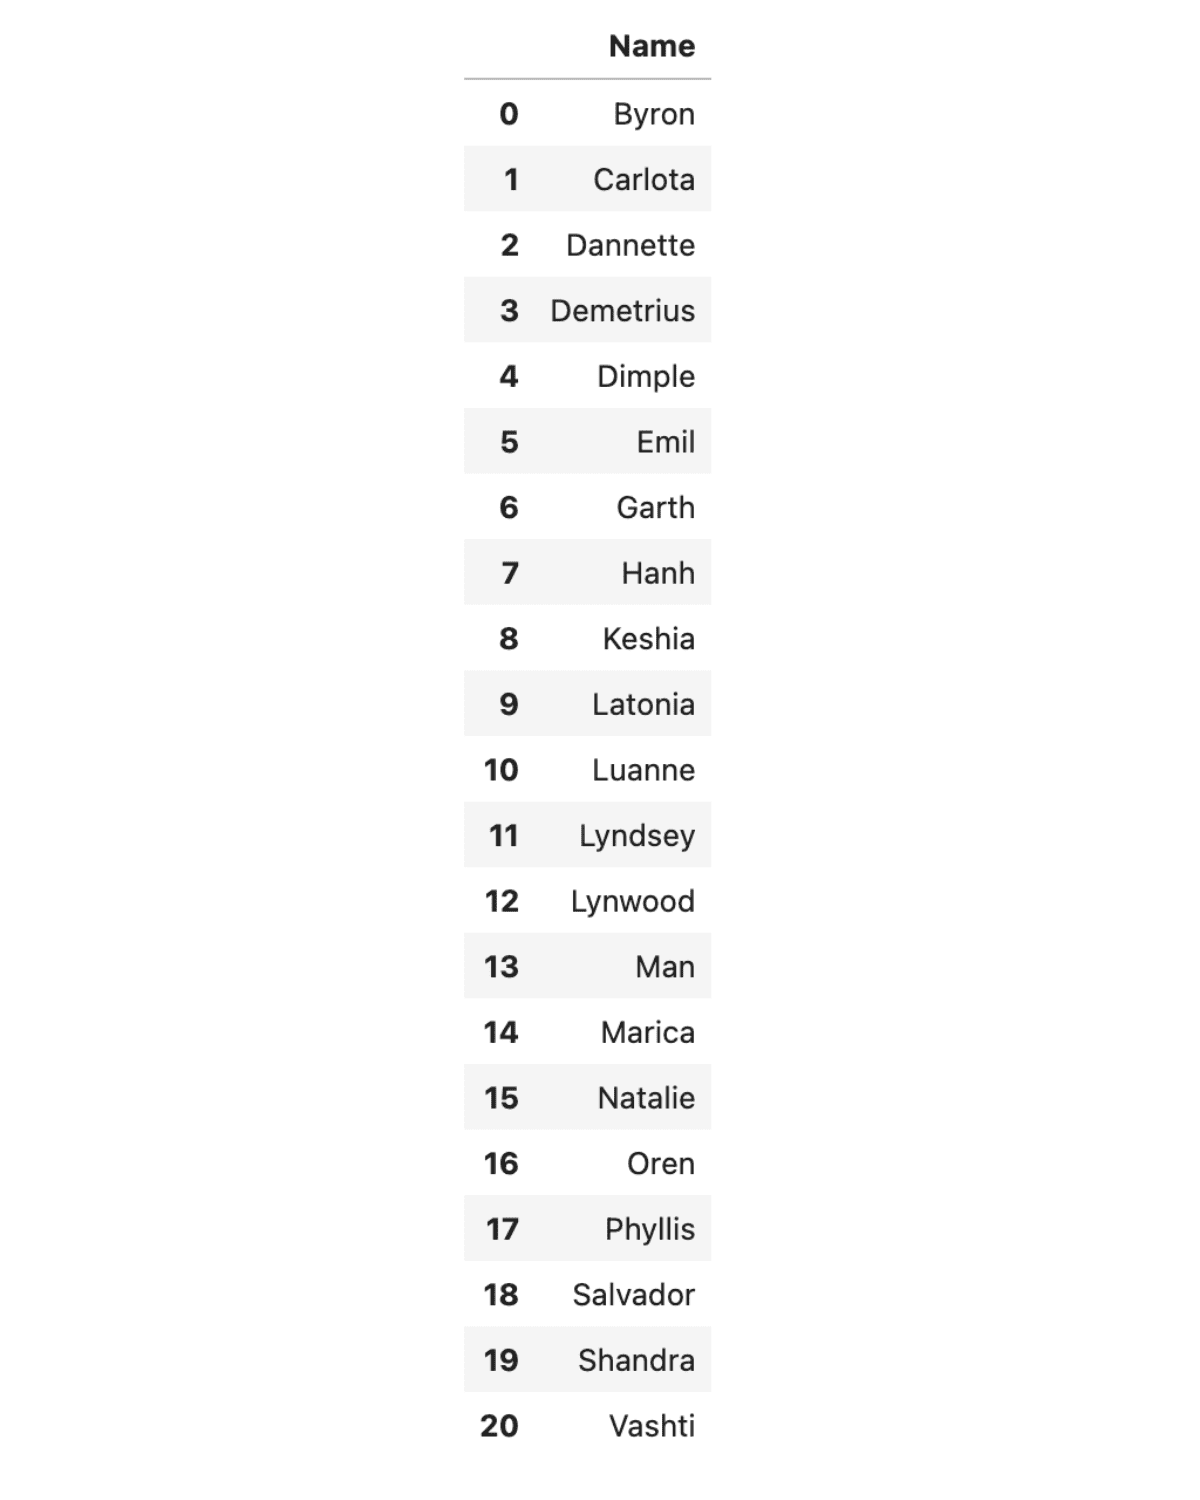

// Step 2: Finishing in Pandas
After filtering the dataset using SQL with pandasql, we switch to Pandas to perform numerical calculations and finalize the analysis. This hybrid technique, which combines SQL and Python, enhances both readability and flexibility.
Next, using the following Python code, we calculate the total payout by multiplying the number of qualified drivers (using len()) by the $50 bonus per driver. Check out the documentation to see how you can use the len() function.
payout_opt1 = 50 * len(opt1_eligible)
print(f"Option 1 payout: ${payout_opt1:,}")
Here is the output.


# Question 2: Calculating the Total Payout for Bonus Option 2
In the second question, we are asked to find the total bonus payout using Option 2:
$4/trip for all drivers who complete 12 trips, and have a 4.7 or better rating.
// Step 1: Filtering the Qualifying Drivers with SQL (pandasql)
First, we use SQL to filter for drivers who meet the Option 2 criteria: completing at least 12 trips and maintaining a rating of 4.7 or higher.
# Grab only the rows that satisfy the Option-2 thresholds
opt2_drivers = run("""
    SELECT Name,
           `Trips Completed`
    FROM   df
    WHERE  `Trips Completed` >= 12
      AND  Rating            >= 4.7;
""")
opt2_drivers.head()
Here’s what we get.
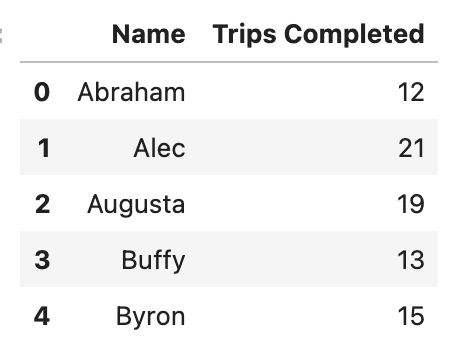

// Step 2: Finishing the Calculation in Pure Pandas
Now let’s perform the calculation using Pandas. The code computes the total bonus by summing the Trips Completed column with sum() and then multiplying the result by the $4 bonus per trip.
total_trips   = opt2_drivers["Trips Completed"].sum()
option2_bonus = 4 * total_trips
print(f"Total trips: {total_trips},  Option-2 payout: ${option2_bonus}")
Here is the result.


# Question 3: Identifying Drivers Who Qualify for Option 1 But Not Option 2
In the third question, we are asked to count the number of drivers who qualify for Option 1 but not for Option 2.
// Step 1: Building Two Eligibility Tables with SQL (pandasql)
In the following SQL code, we create two datasets: one for drivers who meet the Option 1 criteria and another for those who meet the Option 2 criteria.
# All Option-1 drivers
opt1_drivers = run("""
    SELECT Name
    FROM   df
    WHERE  `Supply Hours`    >=  8
      AND  `Trips Completed` >= 10
      AND  `Accept Rate`     >= 90
      AND  Rating            >= 4.7;
""")

# All Option-2 drivers
opt2_drivers = run("""
    SELECT Name
    FROM   df
    WHERE  `Trips Completed` >= 12
      AND  Rating            >= 4.7;
""")
// Step 2: Using Python Set Logic to Spot the Difference
Next, we will use Python to identify the drivers who appear in Option 1 but not in Option 2, and we will use set operations for that.
Here is the code:
only_opt1 = set(opt1_drivers["Name"]) - set(opt2_drivers["Name"])
count_only_opt1 = len(only_opt1)

print(f"Drivers qualifying for Option 1 but not Option 2: {count_only_opt1}")
Here is the output.


By combining these methods, we leverage SQL for filtering and Python’s set logic for comparing the resulting datasets.
# Question 4: Finding Low-Performance Drivers with High Ratings
In question 4, we are asked to determine the percentage of drivers who completed fewer than 10 trips, had an acceptance rate below 90%, and still maintained a rating of 4.7 or higher.
// Step 1: Pulling the Subset with SQL (pandasql)
In the following code, we select all drivers who have completed fewer than 10 trips, have an acceptance rate of less than 90%, and hold a rating of at least 4.7.
low_kpi_df = run("""
    SELECT *
    FROM   df
    WHERE  `Trips Completed` < 10
      AND  `Accept Rate`     < 90
      AND  Rating            >= 4.7;
""")
low_kpi_df
Here is the output.


// Step 2: Calculating the Percentage in Plain Pandas
In this step, we will use Python to calculate the percentage of such drivers.
We simply divide the number of filtered drivers by the total driver count, then multiply by 100 to get the percentage.
Here is the code:
num_low_kpi   = len(low_kpi_df)
total_drivers = len(df)
percentage    = round(100 * num_low_kpi / total_drivers, 2)

print(f"{num_low_kpi} out of {total_drivers} drivers ⇒ {percentage}%")
Here is the output.


# Question 5: Calculating Annual Profit Without Partnering With Uber
In the fifth question, we need to calculate the annual income of a taxi driver without partnering with Uber, based on the given cost and revenue parameters.
// Step 1: Pulling Yearly Revenue and Expenses with SQL (pandasql)
By using SQL, we first calculate yearly revenue from daily fares and subtract expenses for gas, rent, and insurance.
taxi_stats = run("""
SELECT
    200*6*(52-3)                      AS annual_revenue,
    ((200+500)*(52-3) + 400*12)       AS annual_expenses
""")
taxi_stats
Here is the output.


// Step 2: Deriving Profit and Margin with Pandas
In the next step, we will use Python to compute the profit and margin the drivers get when not partnering with Uber.
rev  = taxi_stats.loc[0, "annual_revenue"]
cost = taxi_stats.loc[0, "annual_expenses"]

profit  = rev - cost
margin  = round(100 * profit / rev, 2)

print(f"Revenue  : ${rev:,}")
print(f"Expenses : ${cost:,}")
print(f"Profit   : ${profit:,}    (margin: {margin}%)")
Here’s what we get.


# Question 6: Calculating the Required Fare Increase to Maintain Profitability
In the sixth question, we assume that the same driver decides to buy a Town Car and partner with Uber.
The gas expenses increase by 5%, insurance decreases by 20%, and rental costs are eliminated, but the driver needs to cover the $40,000 cost of the car. We are asked to calculate how much this driver’s weekly gross fares must increase in the first year to both pay off the car and maintain the same annual profit margin.
// Step 1: Building the New One-Year Expense Stack with SQL
In this step, we will use SQL to calculate the new one-year expenses with adjusted gas and insurance and no rental fees, plus the car cost.
new_exp = run("""
SELECT
    40000             AS car,
    200*1.05*(52-3)   AS gas,        -- +5 %
    400*0.80*12       AS insurance   -- –20 %
""")
new_cost = new_exp.sum(axis=1).iloc[0]
new_cost
Here is the output.


// Step 2: Calculating the Weekly Fare Increase with Pandas
Next, we use Python to calculate how much more the driver must earn per week to preserve that margin after buying the car.
# Existing values from Question 5
old_rev    = 58800
old_profit = 19700
old_margin = old_profit / old_rev
weeks      = 49

# new_cost was calculated in the previous step (54130.0)

# We need to find the new revenue (new_rev) such that the profit margin remains the same:
# (new_rev - new_cost) / new_rev = old_margin
# Solving for new_rev gives: new_rev = new_cost / (1 - old_margin)
new_rev_required = new_cost / (1 - old_margin)

# The total increase in annual revenue needed is the difference
total_increase = new_rev_required - old_rev

# Divide by the number of working weeks to get the required weekly increase
weekly_bump = round(total_increase / weeks, 2)

print(f"Required weekly gross-fare increase = ${weekly_bump}")
Here’s what we get.


# Conclusion
Bringing together the strengths of SQL and Python, primarily through pandasql, we solved six different problems.
SQL helps in quick filtering and summarizing structured datasets, while Python is good at advanced computation and dynamic manipulation.
Throughout this analysis, we leveraged both tools to simplify the workflow and make each step more interpretable.
Nate Rosidi is a data scientist and in product strategy. He’s also an adjunct professor teaching analytics, and is the founder of StrataScratch, a platform helping data scientists prepare for their interviews with real interview questions from top companies. Nate writes on the latest trends in the career market, gives interview advice, shares data science projects, and covers everything SQL.
Jobs & Careers
NVIDIA Reveals Two Customers Accounted for 39% of Quarterly Revenue

NVIDIA disclosed on August 28, 2025, that two unnamed customers contributed 39% of its revenue in the July quarter, raising questions about the chipmaker’s dependence on a small group of clients.
The company posted record quarterly revenue of $46.7 billion, up 56% from a year ago, driven by insatiable demand for its data centre products.
In a filing with the U.S. Securities and Exchange Commission (SEC), NVIDIA said “Customer A” accounted for 23% of total revenue and “Customer B” for 16%. A year earlier, its top two customers made up 14% and 11% of revenue.
The concentration highlights the role of large buyers, many of whom are cloud service providers. “Large cloud service providers made up about 50% of the company’s data center revenue,” NVIDIA chief financial officer Colette Kress said on Wednesday. Data center sales represented 88% of NVIDIA’s overall revenue in the second quarter.
“We have experienced periods where we receive a significant amount of our revenue from a limited number of customers, and this trend may continue,” the company wrote in the filing.
One of the customers could possibly be Saudi Arabia’s AI firm Humain, which is building two data centers in Riyadh and Dammam, slated to open in early 2026. The company has secured approval to import 18,000 NVIDIA AI chips.
The second customer could be OpenAI or one of the major cloud providers — Microsoft, AWS, Google Cloud, or Oracle. Another possibility is xAI.
Previously, Elon Musk said xAI has 230,000 GPUs, including 30,000 GB200s, operational for training its Grok model in a supercluster called Colossus 1. Inference is handled by external cloud providers.
Musk added that Colossus 2, which will host an additional 550,000 GB200 and GB300 GPUs, will begin going online in the coming weeks. “As Jensen Huang has stated, xAI is unmatched in speed. It’s not even close,” Musk wrote in a post on X.Meanwhile, OpenAI is preparing for a major expansion. Chief Financial Officer Sarah Friar said the company plans to invest in trillion-dollar-scale data centers to meet surging demand for AI computation.
The post NVIDIA Reveals Two Customers Accounted for 39% of Quarterly Revenue appeared first on Analytics India Magazine.
Jobs & Careers
‘Reliance Intelligence’ is Here, In Partnership with Google and Meta

Reliance Industries chairman Mukesh Ambani has announced the launch of Reliance Intelligence, a new wholly owned subsidiary focused on artificial intelligence, marking what he described as the company’s “next transformation into a deep-tech enterprise.”
Addressing shareholders, Ambani said Reliance Intelligence had been conceived with four core missions—building gigawatt-scale AI-ready data centres powered by green energy, forging global partnerships to strengthen India’s AI ecosystem, delivering AI services for consumers and SMEs in critical sectors such as education, healthcare, and agriculture, and creating a home for world-class AI talent.
Work has already begun on gigawatt-scale AI data centres in Jamnagar, Ambani said, adding that they would be rolled out in phases in line with India’s growing needs.
These facilities, powered by Reliance’s new energy ecosystem, will be purpose-built for AI training and inference at a national scale.
Ambani also announced a “deeper, holistic partnership” with Google, aimed at accelerating AI adoption across Reliance businesses.
“We are marrying Reliance’s proven capability to build world-class assets and execute at India scale with Google’s leading cloud and AI technologies,” Ambani said.
Google CEO Sundar Pichai, in a recorded message, said the two companies would set up a new cloud region in Jamnagar dedicated to Reliance.
“It will bring world-class AI and compute from Google Cloud, powered by clean energy from Reliance and connected by Jio’s advanced network,” Pichai said.
He added that Google Cloud would remain Reliance’s largest public cloud partner, supporting mission-critical workloads and co-developing advanced AI initiatives.
Ambani further unveiled a new AI-focused joint venture with Meta.
He said the venture would combine Reliance’s domain expertise across industries with Meta’s open-source AI models and tools to deliver “sovereign, enterprise-ready AI for India.”
Meta founder and CEO Mark Zuckerberg, in his remarks, said the partnership is aimed to bring open-source AI to Indian businesses at scale.
“With Reliance’s reach and scale, we can bring this to every corner of India. This venture will become a model for how AI, and one day superintelligence, can be delivered,” Zuckerberg said.
Ambani also highlighted Reliance’s investments in AI-powered robotics, particularly humanoid robotics, which he said could transform manufacturing, supply chains and healthcare.
“Intelligent automation will create new industries, new jobs and new opportunities for India’s youth,” he told shareholders.
Calling AI an opportunity “as large, if not larger” than Reliance’s digital services push a decade ago, Ambani said Reliance Intelligence would work to deliver “AI everywhere and for every Indian.”
“We are building for the next decade with confidence and ambition,” he said, underscoring that the company’s partnerships, green infrastructure and India-first governance approach would be central to this strategy.
The post ‘Reliance Intelligence’ is Here, In Partnership with Google and Meta appeared first on Analytics India Magazine.
Jobs & Careers
Cognizant, Workfabric AI to Train 1,000 Context Engineers
Cognizant has announced that it would deploy 1,000 context engineers over the next year to industrialise agentic AI across enterprises.
According to an official release, the company claimed that the move marks a “pivotal investment” in the emerging discipline of context engineering.
As part of this initiative, Cognizant said it is partnering with Workfabric AI, the company building the context engine for enterprise AI.
Cognizant’s context engineers will be powered by Workfabric AI’s ContextFabric platform, the statement said, adding that the platform transforms the organisational DNA of enterprises, how their teams work, including their workflows, data, rules, and processes, into actionable context for AI agents.Context engineering is essential to enabling AI a
-
Tools & Platforms3 weeks ago
Building Trust in Military AI Starts with Opening the Black Box – War on the Rocks
-

 Ethics & Policy1 month ago
SDAIA Supports Saudi Arabia’s Leadership in Shaping Global AI Ethics, Policy, and Research – وكالة الأنباء السعودية
-

 Events & Conferences3 months ago
Journey to 1000 models: Scaling Instagram’s recommendation system
-

 Business2 days ago
The Guardian view on Trump and the Fed: independence is no substitute for accountability | Editorial
-

 Jobs & Careers2 months ago
Mumbai-based Perplexity Alternative Has 60k+ Users Without Funding
-

 Funding & Business2 months ago
Kayak and Expedia race to build AI travel agents that turn social posts into itineraries
-

 Education2 months ago
VEX Robotics launches AI-powered classroom robotics system
-

 Podcasts & Talks2 months ago
Happy 4th of July! 🎆 Made with Veo 3 in Gemini
-

 Podcasts & Talks2 months ago
OpenAI 🤝 @teamganassi
-

 Mergers & Acquisitions2 months ago
Donald Trump suggests US government review subsidies to Elon Musk’s companies

