AI Insights
Fusion of automatically learned rhythm and morphology features matches diagnostic criteria and enhances AI explainability
We used the pre-trained xECGArch15 to classify 1521 unseen ECGs into AF and n-AF. Subsequently model explanations were extracted in terms of each sample’s relevance for classification using DTD for both, the long-term and the short-term model.
The model explanations were combined in xFuseMap to present the long- and short-term relevance information, illustrating the impact of rhythmic and morphological characteristics on the classification decision of xECGArch.
To validate the model-dependent explanations, we developed a generalizable method to quantify the relevance of diagnostically important ECG segments. Subsequently, we statistically examined the relationship between model explanations and morphological characteristics and rhythm.
The classification procedure utilizing xECGArch and the subsequent extraction of the model explanations were conducted in Python 3.9.19 and TensorFlow 2.12. All other operations were performed in Matlab R2021b (MathWorks Inc., Natick, MA, USA).
Data material
We used the unseen training dataset from xECGArch15 and increased the number of NSR nNSR and O nO ECGs using additional unseen data from the same databases to equal the number of AF nAF ECGs (nAF = nNSR = nO = 507) and thus created a balanced dataset. This enabled the statistical examination of differences between AF, NSR, and O in the distribution of relevance values. Although the classes NSR and O were not considered separately but combined during training, differences in the explanations for both classes could indicate the methodology’s transferability.
In total, we used 1521 ECGs from 4 public databases, acessible via PhysioNet42. These included the China Physiological Signal Challenge 2018 (CPSC2018) database43, the Chapman-Shaoxing (ChapShao) database44,45, the Georgia 12-lead ECG Challenge (Georgia) database46,47, and the XL database from the Physikalisch-Technische Bundesanstalt (PTB-XL)5,48. As the majority of the recordings in these databases are 10 s in length, only ECGs of at least this length were used. Shorter ECGs were not considered. Longer ECGs were clipped to the middle 10 s. The distribution of age and sex among the databases and classes, as well as the respective databases’ country of origin, is illustrated in Table 4. None of the databases under consideration provides information regarding the ethnicity of the patients. Given the variability in the countries of origin and the multi-centre nature of most of the databases (unknown for Georgia database), ethnic diversity can be assumed in the overall dataset.
To ensure transferability to future applications in wearables and mobile devices, as used for example in the TIMELY project37,38, we have restricted our analyses to single-lead ECGs. F waves, one of the main characteristics of AF, can be best seen in leads II and V1, since the position and axes of the ECG leads are most suitable for measuring the spatial excitation of both atria40,41. Since leads from mobile devices are usually based on the Einthoven limb leads, we chose lead II for our analyses.
Model parameterization
xECGArch15 is an architecture for automated ECG analysis comprising two parallel 1D CNNs and a combined decision-making process based on the clinical reading of ECGs. Both CNNs share the same architecture, however, the long-term model considers the entire signal duration at once, making it more sensitive to rhythmicity. The short-term model has a short observation period of 0.6 s, making it more sensitive to morphological changes within beats.
Both, the long-term and the short-term CNNs individually analyze and classify an ECG. For the combined decision, the decision reliability values of both models for or against AF are weighted averaged. The highest averaging class values are considered the classification result. This allows us to consider that, depending on the specific CVD, the rhythm and the morphology may be differentially affected. The weights were determined by maximizing the combined F1 score. Various xAI methods have been applied to ECG classification previously (see Table 1). However, our recent findings indicate that the eligibility of xAI methods might be case-dependent, and that the xAI method must therefore be carefully selected to obtain reliable explanations15. With regard to xECGArch, we investigated the reliability of 13 different xAI methods by gradually perturbing and reclassifying the signals. DTD exhibited the most significant decline in classification performance, and thus was selected as the most reliable xAI method for this scenario.
The concept underlying the DTD is the redistribution of the model output to the input components via relevance propagation rules. The relevance of a neuron in the upstream layer is determined by summing the relevance values of all neurons (or neuron outputs) in a layer. This procedure is performed for each neuron in each layer, including the input layer. In contrast to other methods, the DTD only provides information about the relevance of individual samples for and not against the assignment to a class. The DTD explanations in terms of the sample-wise relevance for the classification as AF or n-AF were calculated using the iNNvestigate 2.0 Toolbox49 and subsequently normalized between 0 and 1.
Model explanation fusion (xFuseMap)
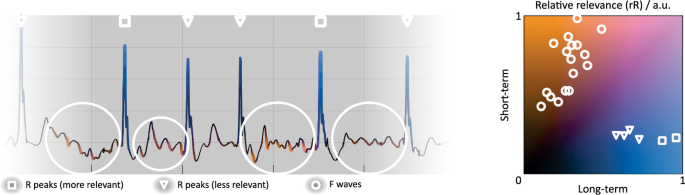
Since both, rhythm and morphology, are pertinent to ECG analysis and the detection of CVDs such as AF, a trusthworthy algorithm should use information from both domains and present relevant areas in a dissociative manner. With xFuseMap, we integrate the relevance information from both domains into a combined saliency map. To ensure interpretability, we color-code the origin of the relevance information in terms of rhythm or morphology, assigning a color to both models. A two-dimensional color space is created with the rR for each model on one axis (see Fig. 5). To achieve a high color contrast, we chose blue for the long-term model and orange for the short-term model. Areas that are relevant to neither or both models are colored black or pink. In the areas in between, the colors blend smoothly. A dark gray background improves visual recognition of relevant areas compared to a light background. Other color combinations are conceivable. By multiplying the rR values by the models’ decision certainties, we account for the reduced significance of uncertain decisions in the combined representation. In addition, the line thickness in the saliency maps for each sample is adjusted to correlate with the maximum relevance value from both models for each sample.
Data points are color-coded according to their relative relevance (rR) in arbitrary units (a.u.) for classification by the long-term and short-term models included in the explainable ECG analysis architecture (xECGArch)15, as indicated by the color map on the right. Relevant ECG characteristics are marked in the saliency map and the color map. F waves, fibrillatory waves.
Fusing the model explanations in xFuseMap therefore requires the following steps:
-
1.
applying xECGArch or two other models with dissociable focus,
-
2.
extracting and normalizing the relevance values of both models for the majority class, and
-
3.
visualizing the combined rR of both models according to xFuseMap, by
Figure 5 shows an example saliency map for the combined explanation of both models in xECGArch for the classification of an AF ECG using xFuseMap. The peaks of the second and fifth QRS complexes (rectangular marking) are highly relevant for the long-term model and hardly relevant for the short-term model, which is why they are located at the bottom right of the color map and are therefore highlighted in clear blue and with a thick line in the saliency map. The remaining QRS complexes (triangular marking) show a lower relevance for the long-term model and still hardly for the short-term model. The relevance values are shifted to the left in the colormap and the corresponding points in the saliency map are colored dark blue. Due to the lower rR, the line for these QRS complexes is thinner.
F waves are clearly recognizable in the ECG, which partially overlap the ST segment or the T wave (circular marking). They are colored orange and highlighted by a thick line, which means that the F waves are highly relevant for the decision, especially for the short-term model and less for the long-term model, which is why the rR values are positioned at the top left of the colormap.
Investigating the class-specific relation between model-dependent relevance and diagnostic criteria
We quantified the relevance of specific ECG segments using a template-based approach to investigate the class-specific relationship between the model-dependent relevance and diagnostic criteria, such as class-specific rhythm or morphology.
A generalizable method for quantifying the relevance of specific ECG segments
To quantitatively evaluate the explanations, we determined the mean rR of all samples within the ECG segments shown in Fig. 6 for each model, as well as its variability in terms of the SD of the segment-averaged rR within a recording.
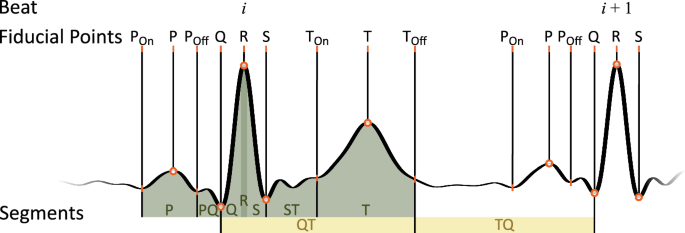
TQ segment was calculated between offset of T wave from beat i and Q of beat i+1.
Each ECG was processed separately. First, the ECGs were band-pass filtered between 0.3 and 120 Hz to remove artifacts and high-frequency noise, and notch filtered at 50 or 60 Hz, depending on the database source, to remove grid noise50,51. Second, to robustly detect the fiducial points of each beat, we applied iterative two-dimensional signal warping (i2DSW)52,53, which implies the reflection of fiducial points of a template beat to every single beat by iteratively fitting the template beat to each individual beat. For this purpose, QRS complexes were automatically detected54,55, beats were extracted54, and then template beats were generated by averaging the beats52,53. Fiducial points were detected using the ECGdeli toolbox50, checked by an expert and corrected manually if necessary.
Subsequently, 9 segments were defined, within which the relevance information was averaged beat-wise, as shown in Fig. 6. The Q and the S segments were defined as the time between the R peak and the Q or S peak, respectively. The TQ segment was defined as the time between the offset of the T wave TOff of beat i and the Q peak of the following beat i+1. This could not be calculated for the last beat as there was no following beat.
We proceeded identically for F waves, that we detected additionally by applying the findpeaks Matlab function to beat-corrected and filtered ECGs56. Beat correction was achieved by subtracting the i2DSW beat adjusted templates from the signal. Subsequently, the beat-corrected signal was band-pass filtered between 5 and 10 Hz.
Statistical analysis of the class-specific relation between model explanations and morphology
The objective of our study was to demonstrate that xECGArch employs information that aligns with clinical knowledge for the detection of AF, and that the short-term model, in contrast to the long-term model, primarily uses morphology features. We therefore considered class- and model-dependent differences in the mean rR as well as the SD of the segment-averaged rR and tested for statistical significance using a two-factor ANOVA for each metric and each model separately. We used segment and class as independent factors and relevance as dependent factor. Only correctly classified ECGs were included in the ANOVA. Furthermore, outliers were identified and removed using the Matlab function isoutlier with outliers being defined as values that were more than three scaled median absolute deviations away from the median. The residuals were tested for normal distribution using the Kolmogorov-Smirnov test, although the execution of the ANOVA did not depend on the result, as the ANOVA is considered robust against violations of the normal distribution57. Subsequently, multiple Student’s t tests were applied as a post-hoc analysis to identify group-specific differences, with Tukey-Kramer’s correction for multiple testing employed to address alpha error accumulation.
Statistical analysis of the relation between model explanations and rhythm
Two analyses were conducted to examine the models’ ability to use rhythm information for classification. Initially, at a beat-to-beat level, we examined whether the altered rhythm observed in AF compared to O and NSR directly translates into a fluctuating rR within segments of the same type. Secondly, at the recording level, we examined whether there is a more complex relation between the RR variability and the variability of rR information within similar segments that cannot be examined at a beat-to-beat level but on an abstracted level. We hypothesized that the change in RR intervals results in a change in the rR in specific segments. Consequently, we considered the absolute difference between consecutive RR intervals (|δRR|) and the absolute differences of segment-specific rR inconsecutive beats (|δrR|) as measures for spontaneous changes in rhythm and rR. It should be noted that we did not exclude abnormal beats. Therefore, |δRR| as a measure of rhythm changes should not be confused with heart rate variability features, which measure the variability of the distance between normal beats. Furthermore, F waves have not been included in these analyses as they are not directly related to the excitation of the ventricles and, therefore, cannot be assigned to individual beats in the ECG.
For beat-to-beat level analysis, we computed the correlation between the Euclidean normalized |δRR| and the |δrR| for all recordings of each class for the long-term and the short-term models separately. Euclidean normalization was implemented using the Matlab normalize function. We used Spearman’s rank correlation analysis as the weighted interconnection in neurons enables NNs to learn complex, non-linear relationships58. The |δRR| time series were normalized using the Euclidean distance on a recording-wise basis to eliminate the influence of the absolute RR interval length, allowing for a relative consideration of RR changes.
For the analysis at the recording level, we calculated the correlation between the mean |δRR| (\(\overline{|\delta RR|}\)) and the mean |δrR| (\(\overline{|\delta rR|}\)) across all recordings of a class for each segment type separately. Given the significance of absolute arrhythmia in AF, we postulated that an increased variability of the RR interval duration would be reflected in the model explanations, particularly in the long-term model, and would be expressed in an increased variability of the relevance of certain segments, particularly the QRS complex. Consequently, we expected \(\overline{|\delta RR|}\) to be linearly reflected in \(\overline{|\delta rR|}\) and thus employed Pearson’s correlation analysis.


AI Insights
A hybrid q-rung linear diophantine fuzzy WASPAS approach for artificial intelligence algorithm selection in physical education

PE is essential for the development of physical fitness, motor skills, mental health, and lifelong healthy habits in students; thus, it is a pillar of holistic education in contemporary institutions. As technology continues to improve at an alarming rate, AI algorithms are becoming increasingly common in the delivery, monitoring, and personalization of PE programs. Real-time performance monitoring, customized feedback, and data-based training programs can be achieved through AI-powered systems, including pose estimation tools, adaptive training optimizers, and interactive coaching assistants, which can dramatically improve learning outcomes and engagement. Nevertheless, the large number of possible AI solutions and the trade-offs between accuracy, adaptability, ease of use, and resource demands necessitate careful and systematic DM to choose the most appropriate AI algorithms for PE requirements. A practical, uncertainty-sensitive DM framework can help educators and administrators make informed, transparent, and sensible decisions, ensuring that the chosen AI technologies support educational objectives and bring the most value to both students and institutions.
To demonstrate the feasibility and practical value of the proposed q-RLDF WASPAS framework, a real-world case study focusing on the selection of the most suitable AI algorithm for enhancing PE programs is chosen. The goal of this case study is to assist PE instructors and institutional DMKs in choosing AI solutions that best align with their objectives of improving training effectiveness, ensuring student safety, and personalizing learning experiences. To provide a balanced and credible evaluation process, three domain experts/DMK were selected based on clear criteria: practical experience in PE technology, technical expertise in AI for sports data analytics, and strategic insight into educational technology policy. Each DMK has at least 5 years of post-qualification experience. This diversity ensures the DM process reflects operational, technical, and organizational realities. Based on recent trends in AI algorithms and DMK’s opinions, five widely recognized AI algorithms \(\:{{\Lambda\:}}_{i},i=\text{1,2},\dots\:,5\) with proven applications in sports science and physical training, are considered alternatives. These alternatives represent a broad spectrum of intelligent capabilities ranging from real-time posture tracking and motion analysis to adaptive training plan generation and personalized feedback delivery. The selected widely recognized AI algorithms with a proven track record in sports science are:
\(\:{{\Lambda\:}}_{1}:\) Convolutional neural network-based motion analysis (CNN-MA),
\(\:{{\Lambda\:}}_{2}:\) Reinforcement learning based training optimizer (RL-TO),
\(\:{{\Lambda\:}}_{3}:\) Expert system for exercise prescription (ES-EP),
\(\:{{\Lambda\:}}_{4}:\) Hybrid AI tutor with natural language processing (HAI-NLP),
\(\:{{\Lambda\:}}_{5}:\) Wearable sensor data mining algorithm (WSDMA).
Following a thorough analysis of recent and relevant literature41,42,43,44,45,46,47,48, eight criteria \(\:{\mathfrak{S}}_{j},\:j\:=\:1,\:2,\:\dots\:,\:8\:\)are identified as the most significant determinants of AI algorithm performance in PE. These requirements encompass various technical, pedagogical, and practical aspects, which play a crucial role in determining the effectiveness and applicability of AI models in dynamic PE settings. They are chosen based on both empirical results and expert opinion on which attributes have a significant impact on the performance of an algorithm in a real educational context. The detail of the criteria is given below:
\(\:{\mathfrak{S}}_{1}:\) Prediction accuracy (The extent to which the algorithm accurately classifies or predicts the physical performance of students, their fitness, or their injury risk).
\(\:{\mathfrak{S}}_{2}:\) Processing time (The duration that it takes to train the AI model and process large amounts of student movement or biometric data).
\(\:{\mathfrak{S}}_{3}:\) Interpretability (How easily coaches, PE instructors, and students can understand how the algorithm makes its predictions or recommendations).
\(\:{\mathfrak{S}}_{4}:\) Resource consumption (The computational and hardware resources needed to deploy and maintain the algorithm).
\(\:{\mathfrak{S}}_{5}:\) Scalability (The capacity to process more and more students, a variety of sports activities, and bigger data without a performance decline).
\(\:{\mathfrak{S}}_{6}:\) Personalization capability (The extent to which the algorithm can be adjusted to the individual physical state of students, their goals, and progress in the long term).
\(\:{\mathfrak{S}}_{7}:\) Integration with existing modules (The ease with which the AI solution will be able to integrate with wearable devices, learning management systems, or innovative campus platforms, and existing PE software).
\(\:{\mathfrak{S}}_{8}:\) Data privacy and security (The level at which the algorithm facilitates safe data processing and adheres to the privacy requirements of sensitive health or biometric data of students).
The interrelationship between the chosen criteria, available AI algorithms, and selection of the best AI algorithm for PE is shown in Fig. 3.
Step 1. In this step, each DMK was independently provided with a structured questionnaire containing eight selected evaluation criteria and five alternatives for AI algorithms. They rated the importance of each criterion and the performance of each AI algorithm against each criterion in the form q-RLDFNs. These preferences are further arranged in the form of decision matrices. The DMK’s preferences are arranged in the form of decision matrices and are given in Tables 1, 2 and 3.
-
a)
\(\:\stackrel{-}{M}{}_{ji}=\frac{1}{\delta\:}\sum\:_{k=1}^{\delta\:}{d}_{ji}^{\left(k\right)}\), used to find group average matrix \(\:\stackrel{-}{M}=\left[\stackrel{-}{M}{}_{ji}\right]\).
-
b)
\(\:{\zeta\:}_{k}=\sum\:_{j=1}^{\beta\:}\sum\:_{i=1}^{\alpha\:}{\chi\:}_{q-RLDF}\left({M}_{ji}^{\left(k\right)},\stackrel{-}{M}{}_{ji}\right)\), is utilized to find the total dissimilarity matrix where \(\:{\chi\:}_{q-RLDF}\left({M}_{ji},\stackrel{-}{M}{}_{ji}\right)\) represents the distance function between two q-RLDFNs given by:
$$\:{\chi\:}_{q-RLDF}\left({M}_{ji},\stackrel{-}{M}{}_{ji}\right)=\sqrt{\frac{1}{4}\left[{\left({{\Gamma\:}}_{{M}_{ji}}-{{\Gamma\:}}_{\stackrel{-}{M}{}_{ji}}\right)}^{2}+{\left({\text{{\rm\:Y}}}_{{M}_{ji}}-{\text{{\rm\:Y}}}_{\stackrel{-}{M}{}_{ji}}\right)}^{2}+{\left({\eta\:}_{{M}_{ji}}-{\eta\:}_{\stackrel{-}{M}{}_{ji}}\right)}^{2}+{\left({\vartheta\:}_{{M}_{ji}}-{\vartheta\:}_{\stackrel{-}{M}{}_{ji}}\right)}^{2}\right]}$$
-
iii)
The consensus level (CL) is measured by using:
$$\:CL=1-\frac{1}{\delta\:}\sum\:_{k=1}^{\delta\:}\frac{{\zeta\:}_{k}}{{\zeta\:}_{max}}\in\:\left[\text{0,1}\right]$$
For predefined consensus threshold \(\:C{L}_{\text{t}\text{h}\text{r}\text{e}\text{s}\text{h}\text{o}\text{l}\text{d}}=0.8\), the computed \(\:CL=0.81\). Therefore, the relation \(\:CL\ge\:C{L}_{\text{t}\text{h}\text{r}\text{e}\text{s}\text{h}\text{o}\text{l}\text{d}}\) is satisfied, and consensus is met.
-
d)
Since there is consensus among DMK’s preferences, consensus-based weights are computed using \(\:{\psi\:}_{k}^{{\prime\:}}=\frac{\raisebox{1ex}{$1$}\!\left/\:\!\raisebox{-1ex}{${\zeta\:}_{k}$}\right.}{\sum\:_{k=1}^{\delta\:}\raisebox{1ex}{$1$}\!\left/\:\!\raisebox{-1ex}{${\zeta\:}_{k\_}$}\right.}\), where \(\:\sum\:_{k=1}^{\delta\:}{\psi\:}_{k}^{{\prime\:}}=0\).
The weights of DMKs and criteria are computed using the above relations, which ought to be \(\:{\psi\:}_{k}^{{\prime\:}}={\left\{\text{0.35,0.40,0.25}\right\}}^{T}\), and \(\:{\psi\:}_{j}={\left\{\text{0.13,0.10,0.15,0.11,0.12,0.13,0.11,0.15}\right\}}^{T}\) respectively.
Step 3. The DMK’s preferences are aggregated to obtain a single combined decision matrix, which collectively exhibits the preferences of all the DMKs. The q-RLDFWA AO used for this purpose is given as:
$$\:\text{q}-\text{R}\text{L}\text{D}\text{F}\text{W}\text{A}\left({\mathcal{Q}}_{qld}^{1},{\mathcal{Q}}_{qld}^{2},\dots\:,{\mathcal{Q}}_{qld}^{\mathcal{n}}\right)=\left(\begin{array}{c}\left\{\sqrt[q]{1-\prod\:_{\sigma\:=1}^{\mathcal{n}}{\left(1-{\left({{\Gamma\:}}_{{\mathcal{Q}}_{qld}^{\sigma\:}}\right)}^{q}\:\right)}^{{{\Xi\:}}_{\sigma\:}}},\prod\:_{\sigma\:=1}^{\mathcal{n}}{\left({\text{{\rm\:Y}}}_{{\mathcal{Q}}_{qld}^{\sigma\:}}\right)}^{{{\Xi\:}}_{\sigma\:}}\right\},\\\:\left\{\sqrt[q]{1-\prod\:_{\sigma\:=1}^{\mathcal{n}}{\left(1-{\left({\eta\:}_{{\mathcal{Q}}_{qld}^{\sigma\:}}\right)}^{q}\:\right)}^{{{\Xi\:}}_{\sigma\:}}},\prod\:_{\sigma\:=1}^{\mathcal{n}}{\left({\vartheta\:}_{{\mathcal{Q}}_{qld}^{\sigma\:}}\right)}^{{{\Xi\:}}_{\sigma\:}}\right\}\end{array}\right)$$
For \(\:q=5\), the aggregated combined decision matrix is provided in Table 4.
Step 4. The criteria are assessed and considered as cost type or benefit type. On assessment, it is observed that \(\:{\mathfrak{S}}_{2}\) and\(\:\:{\mathfrak{S}}_{4}\) are cost-type criteria, while the remaining are benefit-type. The cost type criteria are normalized by inverting the MG and NMG. The normalized decision matrix is denoted by \(\:{M}^{{\prime\:}}\) and shown in Table 5.
$$\:{\mathcal{R}}_{i}^{\left(1\right)}=\sum\:_{j=1}^{\beta\:}\left({\psi\:}_{j}\right)\left({M}_{ij}^{{\prime\:}}\right)$$
The relative significance of alternatives using WSM is provided in Table 6.
$$\:{\mathcal{R}}_{i}^{\left(2\right)}=\sum\:_{j=1}^{\beta\:}{\left({M}_{ij}^{{\prime\:}}\right)}^{{\psi\:}_{j}}$$
The relative significance of alternatives using WPM is provided in Table 7.
$$\:{\mathcal{R}}_{i}=\left({\Omega\:}\right){\mathcal{R}}_{i}^{\left(1\right)}+\left(1-{\Omega\:}\right){\mathcal{R}}_{i}^{\left(2\right)}$$
$$\:{\mathcal{S}}_{{\mathcal{Q}}_{qld}}=\left[\frac{\left({{\Gamma\:}}_{{\mathcal{Q}}_{qld}}\left(\mathcal{x}\right)-{\text{{\rm\:Y}}}_{{\mathcal{Q}}_{qld}}\left(\mathcal{x}\right)\right)+\left({\eta\:}^{q}-{\vartheta\:}^{q}\right)}{2}\right]\in\:\left[-\text{1,1}\right]$$
The calculated score values are given in Table 9. Furthermore, the graphical illustration is shown in Fig. 4.
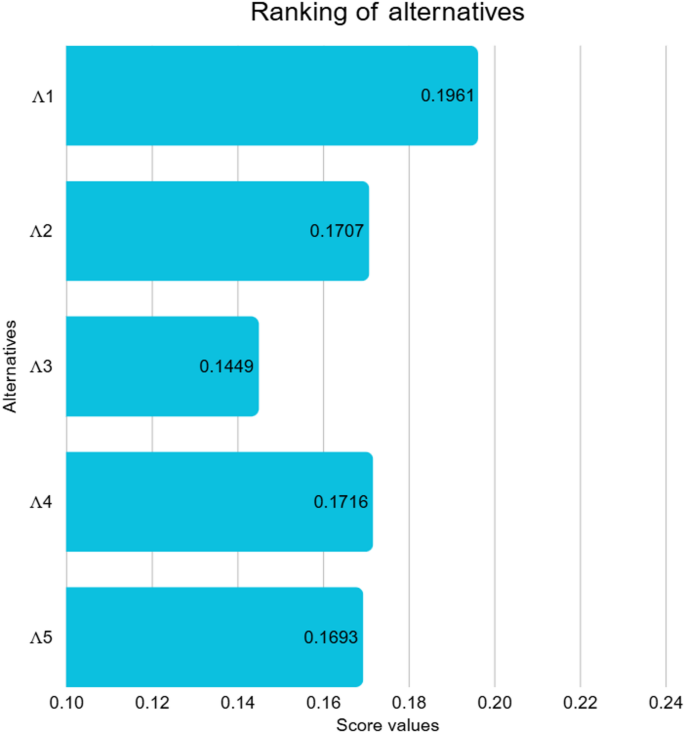
The proposed q-RLDF WASPAS approach provides a structured mechanism for evaluating, ranking, and recommending AI algorithms for PE by systematically capturing the interplay of multiple performance criteria in uncertain situations. Based on the final ranking obtained through our proposed methodology, the CNN-MA emerged as the most effective alternative, demonstrating superior capability in real-time motion tracking and posture analysis, which directly supports physical skill development and form correction. The RL-TO ranked second, reflecting its strong potential to personalize training regimens and adapt workout plans dynamically according to individual learner needs. The HAI-NLP secured the third position, showing promise in enhancing interaction and providing customized feedback through natural language interfaces. The remaining alternatives, WSDMA and the ES-EP, are positioned lower due to relatively limited adaptability and narrower application scopes within dynamic PE contexts. This ranking provides practical guidance for educators and administrators to prioritise AI solutions that best align with optimizing training effectiveness, learner engagement, and real-time performance monitoring in PE environments.
AI Insights
COMMENTARY: How Will AI Impact the Oil and Natural Gas Industry? – Yogi Schulz – Energy News, Top Headlines, Commentaries, Features & Events

By Yogi Schulz
Breathless AI headlines promise superintelligence. However, in today’s oil and gas industry, the impact of AI is more practical—streamlining operations rather than inventing new exploration and production technologies or conquering new markets.
There is a paradox in how AI’s current phase is influencing corporate strategy. While AI is touted as a path to increased profitability, most oil and gas applications of AI today focus on reducing costs, rather than growing revenue. While trimming expenses can boost margins, this action does not deliver sustainable corporate growth.
This article provides actionable answers to AI-related questions that management in the oil and gas industry often asks.
Where is AI having the most immediate and practical impact?
AI is advancing the capability of many categories of engineering application software. Examples include oil and gas software used for predictive maintenance, process optimization and resource allocation. The benefits include reduced operating costs, enhanced safety, improved risk management, and higher confidence in decision-making.
Where will AI have the most impact in the future?
Materials science – Today, the interaction of molecules within mixtures created for materials is almost impossible to predict. This reality leads to endless, high-cost experimentation and lengthy development timelines. DeepMind’s breakthrough work on protein folding is an early example. Oil and gas applications include materials that withstand higher temperatures, pressures, and abrasion.
Text-to-design applications – AI’s ability to generate a 3D design from a short text paragraph will significantly change the nature of engineering design work. It will enable the rapid exploration of many more design alternatives. Oil and gas applications include valves, pressure vessels and gas processing plants.
AI code generation – AI’s ability to generate application code will advance to encompass entire systems. It will shift software development from a hand-crafted process to an automated one. Oil and gas applications include software for SCADA, process control, and autonomous oilsands vehicles.
How is AI changing the industry’s approach to productivity, profitability, and risk management?
AI has produced immediate productivity improvements for most disciplines in:
- Research.
- Document writing.
AI applications identify cost-reduction ideas for capital projects and ongoing operations. The ideas, often in fabrication and maintenance, have increased profitability.
AI applications in many industries actually increase risks, not decrease them. Various AI risks are not yet well understood. Even if the risk of Armageddon-type risks where AI takes over the planet and supplants humans is low, there are other risks.
For example, a recent Bloomberg article described financial risks. It’s a regulator’s nightmare: Hedge funds unleash AI bots on stock and bond exchanges — but they don’t just compete, they collude. Instead of battling for returns, they fix prices, hoard profits and sideline human traders.


Researchers say that scenario is far from science fiction. Every AI application should include a comprehensive risk assessment.
What technical, ethical, or cultural challenges are slowing AI adoption?
Companies contemplating a foray into AI should let someone else make the tools, according to a recent MIT study, which found that 95% of internal AI pilot programs fail to boost revenue or productivity. Often, technical challenges create failure.
According to Fortune magazine, the issue isn’t subpar models, it’s flawed integration. Successful implementations utilize AI to address specific problems with specialized external vendors. These projects succeed twice as often as in-house pilots. MIT also determined that too much AI spend goes to sales and marketing, even though reducing outsourcing and streamlining field operations, HR, and finance drives bigger savings.
The biggest challenge slowing AI adoption is poor data quality in internal datastores used to train the AI model. The cleanup is costly and takes considerable elapsed time. Data quality is a more significant problem for oil and gas applications than for those in many other industries, as they consume significantly more data.
Many executives are concerned about the ethical challenges that AI applications have revealed. These include:
- Risks of misunderstanding basic scientific concepts leading to dangerously wrong recommendations.
- Embarrassingly wrong answers that are termed hallucinations.
- Racial and gender biases.
Addressing the ethical challenges that AI raises requires oversight from management, engineering, and IT leadership.
What’s needed to adopt AI successfully?
Right now, all disciplines are excited by the seemingly endless potential of AI. To add some reality to all the hype, leaders should remember that companies cannot ignore business analysis or treat it superficially with AI. That means:
- Define a problem or opportunity that aligns with targeted and specific business goals – avoid a general exploration of AI technology.
- Measure what matters – don’t expect assertions or output that feels good or looks good to impress anyone.
- Ensure you’re designing for data-driven decisions – you don’t need AI if you will continue working based on experience or gut feel.
- Design human-AI collaboration that leverages their respective strengths – don’t rely exclusively on AI recommendations.
- Ask: Should we? – meaning, do we have a business case?
- Do not just ask Can we? – meaning, do we have the technical and data capability?
What should oil and gas leaders think about?
The responsibility of the board and management for governance suggests that they should focus on guidance to implement AI responsibly and effectively. More specifically, they should give the following specific AI topics attention:
- AI acceptable usage policy – define and implement an acceptable AI usage policy to clearly describe what employee uses are permissible and what is not.
- AI risk management – the fastest and easiest way to implement an AI risk management process is to adopt one of the existing AI risk frameworks. The MIT AI risk framework is one example.
- AI hallucinations – champion the expectation that all AI application development will involve significant efforts to mitigate AI hallucinations.
- Project best practices – AI application projects must adhere to best practices, just like all other projects.
- Cybersecurity for AI applications – to reduce AI cybersecurity risks in applications, the board and the CEO should sponsor a review process that ensures adequate cybersecurity defence features are included in AI applications.
- AI for cybersecurity defences – to address the increasing cybersecurity risks caused by hackers using AI in their attacks, the board and the CEO should sponsor a review process that ensures adequate cybersecurity defences are in place.
Where is AI development headed?
Today, AI is still a people-centred tool. AI waits for us to provide questions to answer. AI developments are advancing the technology to reason more like humans. This reasoning is referred to as AGI, or artificial general intelligence. AGI raises more profound questions:
- Can AI start to ask the right questions or at least propose better questions, not just answer questions we’re smart enough to pose?
- Can AI help professionals in making higher-order decisions for oil and natural gas property development or marketing strategies?
- Will AI supplant technical staff in making routine operational or purchasing decisions? How soon might that step occur?
We will soon enter a new era, where AI does more than simply responding and starts orchestrating. That is the coming age of agentic AI. Agentic AI represents a step forward from reasoning to autonomy, leading to more self-directed initiative.
In many situations, the hardest part is not finding the correct or best answer—it is knowing or at least hypothesizing what the right question or a better question is in the first place. This reality underscores a crucial truth: even the most advanced AI tools rely on human curiosity, perspective, and framing.
In the future, AI development will advance down the creative road toward AGI. Related advances will have a profound impact on all industries, including the oil and natural gas industry.
Yogi Schulz has over 40 years of experience in information technology in various industries. He writes for Engineering.com, EnergyNow.ca, EnergyNow.com and other trade publications. Yogi works extensively in the petroleum industry to select and implement financial, production revenue accounting, land & contracts, and geotechnical systems. He manages projects that arise from changes in business requirements, the need to leverage technology opportunities, and mergers. His specialties include IT strategy, web strategy, and systems project management.
Share This:
More News Articles
-

 Business3 days ago
The Guardian view on Trump and the Fed: independence is no substitute for accountability | Editorial
-
Tools & Platforms3 weeks ago
Building Trust in Military AI Starts with Opening the Black Box – War on the Rocks
-

 Ethics & Policy1 month ago
SDAIA Supports Saudi Arabia’s Leadership in Shaping Global AI Ethics, Policy, and Research – وكالة الأنباء السعودية
-

 Events & Conferences3 months ago
Journey to 1000 models: Scaling Instagram’s recommendation system
-

 Jobs & Careers2 months ago
Mumbai-based Perplexity Alternative Has 60k+ Users Without Funding
-

 Funding & Business2 months ago
Kayak and Expedia race to build AI travel agents that turn social posts into itineraries
-

 Education2 months ago
VEX Robotics launches AI-powered classroom robotics system
-

 Podcasts & Talks2 months ago
Happy 4th of July! 🎆 Made with Veo 3 in Gemini
-

 Podcasts & Talks2 months ago
OpenAI 🤝 @teamganassi
-

 Mergers & Acquisitions2 months ago
Donald Trump suggests US government review subsidies to Elon Musk’s companies