Sequence representation
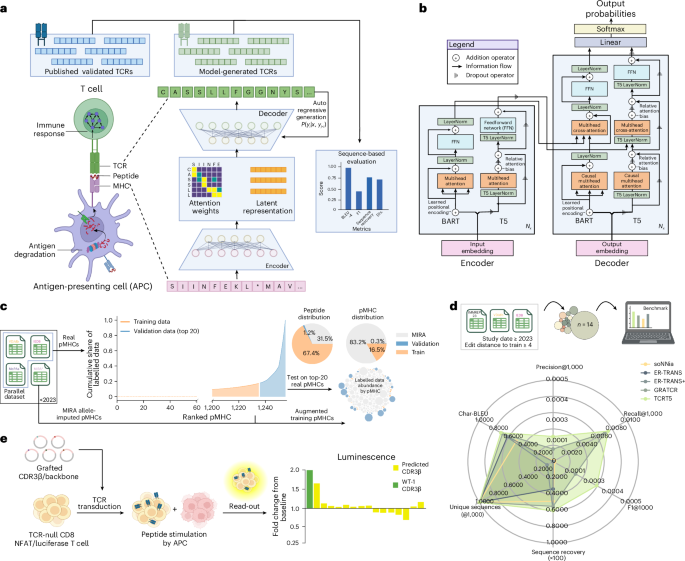
We adopt the same seq2seq framework introduced in ref. 16, relaxing the direction of the pMHC→TCR source–target pairs to train on pMHC→TCR and TCR→pMHC, but evaluate on the former. To represent the TCR-pMHC trimeric complex, comprising three subinteractions (TCR-peptide, TCR-MHC and peptide-MHC) as a source–target sequence pair, we made a few simplifying assumptions that allowed for a more straightforward problem formulation. First, we assume a stable pMHC complex, reducing the problem space to a dimeric interaction between TCR and pMHC. Second, we focus on the variable amino acid residues at the binding interface. For the TCR, we use the CDR3β loop, a contiguous span of 8–20 amino acids that typically make the most contact with the peptide38. Similarly, for the pMHC, we use the whole peptide and the MHC pseudo-sequence, defined in ref. 39 as a reduced, non-contiguous, string containing the polymorphic amino acids within 4.0 Å of the peptide. We opt for a single-character amino-acid-level tokenization, primarily for its interpretability40. In addition to the 20 canonical amino acids, we use standard special tokens to encode semantic information pertaining to the structure of the sequences including the start of sequence [SOS], end of sequence [EOS], masking [MASK], padding [PAD] and a separator token [SEP] to delineate the boundary between the concatenated peptide and pseudo-sequence. For TCRT5, we additionally employ the use of sequence-type tokens [TCR] and [PMHC], retained from T5’s use of task prefixes20, to designate the translation direction:
TCRBART:
[SOS]EPITOPE[SEP]PSEUDOSEQUENCE[EOS]↔[SOS]CDR3BSEQ[EOS]
TCRT5:
[PMHC]EPITOPE[SEP]PSEUDOSEQUENCE[EOS]↔[TCR]CDR3BSEQ[EOS]
Of note, this formulation is extensible to other sequence representations of both TCR and pMHC by using the [SEP] token to delineate the α- and β-chain information for CDR3, multiple CDRs, and even full-chain sequence representations. Similarly, this approach can be used for the full MHC sequence as well.
Dataset construction
Core parallel corpus
Our parallel corpus comprised experimentally validated immunogenic TCR-pMHC pairs taken from publicly available databases (McPAS41, VDJdb27 and IEDB28). All data were collected before May 2023. Additionally, we used a large sample of partially labelled data derived from the MIRA42 dataset, which contained CDR3β and peptide sequences, but contained MHC information at the haplotype resolution instead of the actual presenting MHC allele. Therefore, the presenting MHC allele was inferred from the individual’s haplotype using MHCflurry 2.0’s43 top-ranked presentation score for the listed alleles. Of importance, these allele-imputed examples were not used in the evaluation. To aggregate the data spanning various sources, formats and nomenclature, we mapped the columns from each individual dataset to a common consensus schema and concatenated the data along the consensus columns. Missing values were reasonably imputed based on other information for that data instance. To keep only the cytotoxic (CD8+) T cells, we filtered the instances in which the cell type was provided or the HLA allele was of MHC class I. Once the data were aggregated and the values were imputed, we applied the following column-level standardization for each source of information:
-
CDR3β, epitope and MHC pseudo-sequence: all amino acid representations were normalized using the ‘tidytcells.aa.standardise’ function found in the tidytcells Python package44.
-
TR genes: the tidytcells package44 was once again used to standardize the nomenclature surrounding the TCR genes (for example, TRB-V and TRB-J).
-
HLA allele: HLA allele information was parsed and standardized to the HLA-[A,B,C]*XX:YY format using the ‘mhcgnomes’ package (https://github.com/pirl-unc/mhcgnomes), and only the parsed entities that identified as alleles were retained whereas those with serotype and class-level resolution were filtered. For a small number of cases in which mhcgnomes identified an allele group but was unable to find/parse protein-level information, we imputed the protein field by incrementing from ‘*01’ until a matching IMGT allele was found. Although this step has the potential of introducing differences between the imputed pseudo-sequence and the ground truth, we anticipate this source of noise to have a minor effect as the MHC pseudo-sequence is well conserved within the serotype. HLA alleles were imputed when necessary and then normalized using the mhcgnomes package to the standard HLA-[A,B,C]*XX:YY format.
Once aggregated, only entries derived from human studies with MHC class I peptides were retained. Additionally, entries with the minimal information of HLA, peptide and CDR3β were retained. No other data filtration was performed for the training and validation splits.
Training/validation split
To assess the feasibility of having the models sample antigen-specific sequences for unseen epitopes, we held out a validation set of the top-20 most-target-rich pMHCs. We trained on the remaining data, further removing the occurrences of the held-out, epitope-bound alternate MHCs to ensure a clean validation split (Fig. 1c). We retained training sequences with a low edit distance to the validation pMHCs to better understand their influence on performance. The degree to which these sequences exhibit training set similarity is reflected in Extended Data Table 1. The parallel corpus was subsequently de-duplicated to remove near duplicates (peptides with the same allele and a ≥6-mer overlap), which we found to marginally help the overall performance, in accordance with ref. 45. This resulted in a final dataset split of ~330k training sequence pairs (N = 6,989 pMHCs) and 68k validation sequence pairs (N = 20 pMHCs). A key limitation of our validation dataset is its bias towards mainly viral epitopes and a very narrow HLA distribution towards well-studied alleles.
Unlabelled ‘monolingual’ data
We hypothesized that pretraining the encoder–decoder model using self-supervised methods on pMHC and TCR sequences could help boost the translation performance of the model by learning better representations for source and target sequences, as that in ref. 46, which crucially has been shown to improve performance in the low-resource setting21. For the unlabelled pMHC sequences, we used the positive MHC ligand binding assay data from IEDB (N ≈ 740k)28. For the TCR sequences, we used around (N ≈ 14M) sequences from TCRdb47, out of which around 7M CDR3β sequences were unique. For this dataset, we chose to retain duplicate CDR3β sequences as the TCRdb was amassed over multiple studies and populations; therefore, we felt that the inclusion of duplicate CDR3β sequences was reflective of convergent evolution in the true unconditional TCR distribution.
Benchmark ‘test’ data
To fairly compare TCRT5 against external models ER-TRANSFORMER17 and GRATCR18, we looked for data that would not advantage any one model over the other. This meant that we needed to find data that were not from any training set or validation set, which would have introduced leakage via model selection. Since GRATCR was fine-tuned exclusively on MIRA data, filtering for our training and validation sets would cover the GRATCR model. However, since we were not able to find the training set for ER-TRANSFORMER, we adopted a slightly more stringent data inclusion policy. To account for both ours and ER-TRANSFORMER’s dataset, we aimed to find paired TCR-pMHC data from recent studies (2023 onwards) and filter for epitopes that were at least five amino acid edits away from anything in our training set. For its distributed use and well-characterized performance, the IMMREP2023 TCR specificity competition10 was used along with recent exports from VDJdb and IEDB, which were accessed on 25 March 25 and 1 April 2025, respectively. To ensure that quality examples were taken from VDJdb, entries with a confidence score of ≥2 were chosen. After applying our filtering criteria, we were left with four pMHCs from the IMMREP2023 dataset, four pMHCs from IEDB and eight pMHCs from VDJdb. After manually examining the 16 pMHCs and validating their assay conditions, two pMHCs from VDJdb that shared the same peptide ‘RPIIRPATL’ were dropped due to their inclusion in a 2021 study. The final test set consisted of 14 epitopes with the ‘RVRAYTYSK’ epitope, which contained 895 unique CDR3β sequences, being removed from the benchmark set to have n = 13 pMHCs for the benchmark and the ‘RVRAYTYSK’ epitope as an in silico simulation. The degree to which these sequences exhibit training set similarity is reflected in Extended Data Table 2.
Supplementary Note A.11 provides more information.
Model training
Pretraining
TCRBART was pretrained using masked amino acid modelling (BERT style48), whereas TCRT5 utilized masked span reconstruction, learning to fill in randomly dropped spans with lengths between 1 and 3. Of importance, neither model was trained on complete sequence reconstruction to reduce the possibility of memorization during pretraining. Both models were trained on unlabelled CDR3β and peptide-pseudo-sequences, simultaneously pretraining the encoder and decoder, inspired by the MASS/XLM approach49,50. Unlike MASS/XLM, we omitted per-token learned language embeddings, allowing TCRBART to learn from the size differences between CDR3β and pMHC sequences and TCRT5 to use the [TCR] and [PMHC] starting tokens. To address the imbalance in sequence types, we upsampled sequences for a 70/30 TCR/pMHC split.
Direct training/fine-tuning
For the parallel data, we used the same three training protocols (baseline, bidirectional and multitask) for direct training from random initialization as well as fine-tuning from a pretrained model. This was done by extending the standard categorical cross-entropy loss function (equation (1)), favoured in seq2seq tasks for its desired effect of maximizing the conditional likelihoods over target sequences51,52. For the baseline training, we used the canonical form of the cross-entropy loss, as shown below:
$$\begin{array}{rcl}{\mathcal{L}}&=&{\rm{CE}}({\bf{y}},\hat{{\bf{y}}})=-\mathop{\sum }\limits_{i=1}^{n}{{\bf{y}}}_{i}\log [{\hat{{\bf{y}}}}_{i}]\\ &=&-\mathop{\sum }\limits_{i=1}^{n}\mathop{\sum }\limits_{j-1}^{k}{y}_{ij}\log [{p}_{\theta }({y}_{ij}| {\bf{x}})]\end{array}.$$
(1)
The bidirectional and multitask models were trained using multiterm objectives, forming a linear combination of individual loss terms corresponding to the cross-entropy loss of each task/direction.
$${{\mathcal{L}}}_{\rm{bidxn}}={{\mathcal{L}}}_{pmhc\to tcr}+{{\mathcal{L}}}_{tcr\to pmhc}$$
(2)
$${{\mathcal{L}}}_{\rm{multi}}={{\mathcal{L}}}_{mlm}+{{\mathcal{L}}}_{pmhc\to tcr}+{{\mathcal{L}}}_{tcr\to pmhc}$$
(3)
To mitigate the effects of model forgetting with stacking single-task training epochs, we shuffled the tasks across the epoch using a simple batch processing algorithm (Algorithm 1). After the batch was sampled, it was rearranged into one of four seq2seq mapping possibilities and trained on target reconstruction with the standard cross-entropy loss, which was used for backpropagation. In this way, we could ensure that the model was simultaneously learning multiple tasks during training. For the bidirectional model, this was straightforward as we could swap the input and output tensors during training to get the individual loss contributions of \({{\mathcal{L}}}_{\rm{pmhc\to tcr}}\,{\text{and}}\,{{\mathcal{L}}}_{tcr\to pmhc}\) (equation (2)). For the multitask model, the mapping possibilities are (1) pMHC→TCR, (2) TCR→pMHC, (3) masked/corrupted pMHC*→pMHC and (4) masked/corrupted TCR*→TCR, which combine to form \({{\mathcal{L}}}_{\rm{multi}}\) (equation (3)). These tasks and sequence mappings as seen by TCRBART and TCRT5 are summarized in Fig. 2b.
Algorithm 1
Multitask training step.
Batched input: source pMHCs, X; target TCRs, Y
Sample a ≈ Bernoulli(0.5)
if a > 0.5 then
Swap X and Y
Compute attention masks
end if
Sample b ≈ Bernoulli(0.5)
if b > 0.5 then
Set X = X* and Y = X
Compute attention masks
end if
do Predict \(\hat{{\bf{Y}}}=\phi ({\bf{X}})\) and gradient updates on CE(y, \(\hat{{\bf{y}}}\))
For the purposes of comparison between models originating from different training schemes, each of the models was trained for 20 epochs, from which the checkpoint with the highest average overlap to the known TCR reference set (F1 score) was chosen. We chose this approach to characterize the models’ real-world potential under optimal conditions, as opposed to training for a fixed number of steps or even a fixed number of steps per task (Supplementary Note A.6).
Evaluation
To evaluate antigen specificity, we build our framework around sampling exact CDR3β sequences from published experimental data on well-characterized validation epitopes not seen during training. This approach has an interpretable bias compared with black-box error profiles, at the cost of potentially under-representing actual performance. We calculate sequence-similarity-based metrics beyond exact overlap to create a more robust evaluation framework, and characterize their concordances for future use on epitopes with fewer known cognate sequences. Broadly, our metrics can be summarized as evaluating the accuracy of the returned sequences, their diversity or some combination of the two. They are summarized in brief below:
Accuracy metrics
-
Char-BLEU: following BLEU-4 (ref. 53), the character-level BLEU calculates the weighted n-gram precision against the k = 20 closest reference sequences to abate the unintended penalization of accurate predictions under a large reference set. We use NLTK’s ‘sentence_bleu’ function to calculate a single translation’s BLEU score and the ‘corpus_bleu’ function to compute the BLEU score over an entire dataset.
-
Native sequence recovery: we compute the index-matched sequence overlap with the closest known binder of the same sequence length, when available. This is the same as the length-normalized Hamming distance. The Levenshtein distance normalized to the length of closest reference was used for cases in which a size-matched reference did not exist.
-
mAP: borrowed from information retrieval, mAP measures the average precision across the ranked model predictions. Here we rank the generations by model log-likelihood scores and take the average of the precisions at the top-1, top-2, top-3… top-k ranked outputs. Then, we take the mean over the various pMHCs’ average precision values to get the mAP. This metric gauges the accuracy of the model as well as the calibration of its sequence likelihoods.
-
Biological likelihood: to assess the plausibility of model outputs independent of antigen specificity or labelled data, we compute the generation probability of predictions using OLGA, a domain-specific generative model that infers CDR3β sequence likelihood26.
Diversity metrics
-
Total unique sequences: as a measure of global diversity, we compute the number of total unique generations across the top-20 validation pMHCs as a diversity metric that captures model degeneracy and input specificity. This metric is a function sampling depth and is dependent on the relatedness or model-perceived relatedness of the input epitopes in a dataset.
-
Jaccard similarity/dissimilarity index: the Jaccard index or the Jaccard similarity score is used to measure the similarity of two sets and is calculated as the size of the intersection divided by the union of the two sets. Since the Jaccard index is inversely proportional to diversity, one minus the Jaccard index is used to represent diversity between two sets.
-
Positional Δentropy: to quantify the change in diversity between the models’ outputs and the reference distribution per CDR3β position, we report H(qi) – H(pi) over the Kullback–Leibler divergence to get a signed change in entropy between the amino acid usage distribution of reference distribution q and sample distribution p at position i.
Both
-
Precision@K: borrowed from information retrieval, this metric is calculated by sampling K sequences from the model, with the key distinction that we do not include rank. Here we count the true positives as the exact sequence overlap to the reference target sequences and false positives are chosen, although restrictively, as sequences that do not occur in the reference set. These quantities are combined to compute precision as follows:
$$\,\text{Precision}=\frac{\text{True Positives (TP)}}{\text{True Positives (TP)}+\text{False Positives (FP)}\,}.$$
-
Recall@K: also taken from information retrieval, this metric uses exact sequence overlap to measure the model’s ability to sample the breadth of reference sequences, which we calculate to be the minimum between K and the number of total reference sequences to ensure this metric ranges from 0 to 1:
$$\,\text{Recall}=\frac{\text{True Positives (TP)}}{\min(K,\text{Total Reference Sequences})}.$$
-
F1@K: the F1 score is computed as the harmonic mean of precision and recall, useful for its ability to capture a balanced picture between precision and recall:
$$\,\text{F1}=2\times \frac{\text{Precision}\times \text{Recall}}{\text{Precision}+\text{Recall}}.$$
-
k-mer spectrum shift: as used in the DNA sequence design space54, the k-mer spectrum shift measures the Jensen–Shannon (JS) divergence between the k-mer usage frequency distributions of two sets of sequences across different values of k. Here we compare the JS divergence between the distribution of k-mers derived from a pMHC’s model generations and its reference set of sequences.
TCRT5 data ablation
To evaluate the impact of specific training decisions, we conducted an ablation study by removing key complexities of our training and data pipelines and measuring their effects on model performance. We started with our chosen model, TCRT5, fine-tuned on the single-task TCR generation with semisynthetic MIRA42 data. Next, we retrained the model without the MIRA data for an equivalent number of steps to assess its contribution. Finally, we removed pretraining altogether, training a model on the reduced dataset from random initialization.
To avoid over-representing the performance of the model trained on MIRA data on similar validation examples, we specifically removed three pMHCs that were a single-edit distance from a MIRA example with a greater than 5% overlap in their cognate CDR3β sequences (LLLDRLNQL, TTDPSFLGRY and YLQPRTFLL) from the validation set. For all the models, we used the same checkpoint heuristic, selecting the model with the highest F1 score.
In silico benchmark
GRATCR
For running GRATCR on the test set peptides, we followed the instructions provided by the GRATCR team18 (https://github.com/zhzhou23/GRATCR). We ran the beam search decoding as provided. Since conditional likelihoods were not output by their beam implementation, the sampled sequence index was used as the translation rank. The script to sample the fine-tuned GRATCR was used as follows:
python GRA.py –data_path=”./data/benchmark_peptides.csv”
–tcr_vocab_path=”./Data/vocab/total-beta.csv”
–pep_vocab_path=”./Data/vocab/total-epitope.csv”
–model_path=”./model/gra.pth” –bert_path=”./model/bert_pretrain.pth”
–gpt_path=”./model/gpt_pretrain.pth” –mode=”generate”
–result_path=”./gratcr_benchmark_results.csv” –batch_size=1 –beam=1000
ER-TRANSFORMER
ER-TRANSFORMER was run using the unique amino acid model for a more direct comparison to TCRT5. We utilize the seq_generate method as described in their codebase with the default parameters shown in https://github.com/TencentAILabHealthcare/ER-BERT/ under Code/evaluate_seq2seq_MIRA.py as used by the ER-BERT team17. The translation rank was computed in the same manner as for TCRT5 using the Hugging Face infrastructure around model.generate. The code for sampling the ER-TRANSFORMER is shown below:
def seq_generate(input_seq, max_length, input_tokenizer, target_tokenizer, beams, k=1000):
input_tokenized = input_tokenizer(” “.join(input_seq),
padding=”max_length”,
max_length=max_length,
truncation=True,
return_tensors=”pt”)
input_ids = input_tokenized.input_ids.to(“cpu”)
attention_mask = input_tokenized.attention_mask.to(“cpu”)
outputs = model.generate(input_ids,
attention_mask=attention_mask,
num_beams=beams,
num_return_sequences=k)
output_str = target_tokenizer.batch_decode(outputs, skip_special_tokens=True)
output_str_nospace = [s.replace(” “, “”) for s in output_str]
output_str_nospace = [s for s in output_str_nospace if s != “”]
return output_str_nospace
Additionally, we observed that the ER-TRANSFORMER performance was greatly improved using a post hoc editing step to the translations by simply adding a leading cysteine and ending phenylalanine wherever missing. Although this decreased the number of unique sequences, indicating that ER-TRANSFORMER was sampling both sequences with and without the required C and F, we felt that the large increase in accuracy warranted its inclusion for a fair benchmark and annotate this amended model ER-TRANSFORMER+, which we hold as a fairer comparison of the methods.
Modified F1 scores
In the sparse setting, evaluating the model performance using exact sequence recovery is zero inflated when this may not be the case if sufficient known binders were available. To help alleviate this, we took a principled approach of calling sequences true positives. The first was using sequence recovery values of >90% to a known reference CDR3β. Second, we used the GIANA 4.1 (ref. 29) clustering algorithm to cluster the generated samples with known reference sequences. Purported positives were the generated samples that clustered with a reference sequence. GIANA was run using only CDR3β information and all of the default settings using the following command:
python GIANA4.1.py -f cdr3b_input_file_path -v False
In vitro validation
To further evaluate the ability of TCRT5 to generate epitope-specific CDR3β sequences for sparsely validated epitopes, we attempted to experimentally characterize a list of predicted CDR3β sequences for leukaemia-associated antigen, the HLA-A*02:01 presented WT1 (VLDFAPPGA)31 to be grafted on a well-characterized TCR-T32 using the sequence identified in ref. 55. From the list of generated CDR3β sequences, we selected 40 for in vitro validation. We chose 20 sequences of the same length as the original CDR3β sequence (13 AA) by oversampling TCRT5 and choosing the first 20 sequences of length 13. Additionally, we chose 20 sequences of variable CDR3β lengths by sampling 100 sequences from TCRT5 and taking every fifth sequence starting from the first, ranging from 15–17 AA long.
Retroviral transduction
Predicted CDR3β sequences (Extended Data Table 3) were synthesized as gBlocks (IDT, custom) and cloned into a standard SFG retroviral backbone vector56 containing the full-length WT1 TCR sequence. Sequences were codon optimized for expression in human cells and cloned plasmids were validated by Oxford Nanopore sequencing (Plasmidsaurus). TCR-retroviral supernatants were generated using 293T cells and co-transfection of the TCR-SFG, RDF and PegPam3 plasmids with GeneJuice Transfection Reagent (Sigma, 70967-5). Viral supernatants were harvested at 48- and 72-h post-transfection, snap frozen and stored at –80 °C. Transductions were performed using RetroNectin (Takara, T100A) according to the manufacturer’s recommendations.
TCR expression
TCRs were transduced into a genetically engineered Jurkat cell line (Promega, GA1182). The cell line is deficient in endogenous α and β chains (TCR-KO) and constitutively expresses both CD4 and CD8 co-receptors. Additionally, the TCR-KO Jurkats are engineered to express an NFAT-inducible luciferase reporter construct. Following transduction, TCR expression on the cell surface was evaluated by flow cytometry. Before staining, cells were incubated with 50-nM dasatinib for 30 min at 37 °C, shown to improve T cell staining57. TCR-Jurkats were then labelled with the following fluorochrome-labelled monoclonal antibodies: CD8-BV421 (BioLegend, 344748) and TCRα/β-PE (IP-26, BioLegend, 984702). Samples were also stained for viability using Live/Dead Fixable Near-IR (Thermo, L10119) and run on a BD Fortessa flow cytometer (BD Biosciences). Analysis was performed with FlowJo (v. 10.10.0)
T cell activation and luminescence read-out
To assess T cell activation, 4 × 10⁵ TCR-T Jurkats were cultured in a 96-well plate for 6 h with peptide or DMSO-pulsed T2 cells at a 10:1 effector-to-target ratio. Before co-culture, T2 cells were pulsed overnight at 1 × 10⁶ cells ml−1 supplemented with 10-μM peptide. Peptides were synthesized at GenScript with >95% purity (GenScript, custom). Luciferase expression was measured using the Bio-Glo-NL assay system (Promega, J3081) according to the manufacturer’s protocol. Luminescence was measured as relative luminescent units (RLUs) using a BioTek Synergy 2 microplate reader. All the reported values were normalized by subtracting the average luminescence values of the media control wells. Comparisons against the peptide-null control (DMSO) are reported as fold change values. Selected TCRs were also screened against a set of control peptides: HA-1 (VLRDDLLEA), a minor histocompatibility antigen commonly targeted in leukaemia, and CEFX Ultra SuperStim Pool MHC-I Subset (JPT, PM-CEFX-4), a mix of 80 class I bacterial and virally derived peptides known to react across a range of class I MHC alleles.
Statistics
Fisher’s exact test (one sided) was used to determine the P values for Pbidxn and Pmulti for quantifying the difference in number of polyspecific TCRs sampled. This was computed using the ‘scipy.stats’ Python library. Pairwise Student’s t-test was computed for tests of significance between peptide and DMSO controls for all biological validation data.