The leverage method is a diagnostic tool used to identify influential data points in regression analysis. It evaluates how far the values of a data point’s input variables deviate from the mean of all input values. High leverage points can exert strong influence on the model’s predictions. In combination with standardized residuals, leverage values are often used in Williams plots to detect outliers or influential observations. A data point is typically considered influential if its leverage value exceeds a specific threshold, and its standardized residual is large. The initial equation expresses the difference Di as follows (Eq. 15)34,40,46,47,48:
$${D_i}={X_{\Pr ed,i}} – {X_{Exp,i}}$$
(15)
In this context, Di represents the residual for i-th point, calculated as the difference between the predicted pH value (XPred, i) and the experimentally observed pH (XExp, i) in the culture media affected by bacterial growth. This residual quantifies the prediction error for each data point within the dataset. The standardized residual (SDi) is defined by the subsequent Eq. (16):
The standardized residual (SDi) is obtained by dividing the raw residual (the difference between predicted and experimental values) by the standard deviation of all residuals. This normalization allows for consistent detection of outliers by comparing how far each point deviates from the model’s general trend. Figure 2 illustrates the identification of outliers in the pH dataset for bacterial growth using the leverage method, presented via a Williams plot. The denominator normalizes the residual by the standard deviation of residuals, adjusted by the leverage hi, which measures the impact of every data point on the model’s alignment. The leverage threshold h∗ is calculated as h∗=3(m + 1)/N, where m is the number of input features (5 in this study: bacterial type, culture medium type, initial pH, time, and bacterial cell concentration) and N is the dataset size. For this dataset, h∗=3(5 + 1)/379 = 0.0475. Data points with hi> h∗ are deemed high-leverage points, suggesting potential influence, while standardized residuals exceeding typical thresholds (commonly ∣SDi∣>3) are flagged as outliers. This analysis confirms the dataset’s suitability for pH prediction modeling and provides valuable insights into the dynamics of bacterial growth and pH interactions in culture media.
Fig. 2
Identification of outliers using the Leverage approach.
Hyperparameters optimization and models evaluation
To optimize the performance of each machine learning model, key hyperparameters were tuned using trial-and-error methods guided by performance metrics such as R² and MSE. While detailed optimization procedures were initially illustrated through individual figures for each model, these plots and their corresponding analyses have been moved to the Supporting Material (Figures S1–S4) to enhance clarity and reduce visual overload in the main text. Hyperparameters for all models were meticulously optimized using CSA algorithm to ensure peak performance and avoid overfitting. A summary of the optimal hyperparameter configurations for each model is presented in Table 2, which was found to be sufficient for conveying the necessary results without excessive redundancy. This adjustment was made in accordance with reviewer recommendations, ensuring that the main body of the manuscript remains concise and reader-friendly.
Table 2 Optimal hyperparameter values for each machine learning model.
Table 3 offers a detailed overview of the performance metrics for seven artificial intelligence models, including DT, RF, EL, AdaBoost, ANN, 1D-CNN, and LSSVM, developed to predict pH variations in culture media influenced by bacterial growth. The assessment utilized three primary metrics: R², RMSE, and MAPE%, computed for the training (303 points), testing (76 points), and total datasets.
The results in Table 3 establish a distinct performance hierarchy among the models. The 1D-CNN demonstrated the highest predictive accuracy, achieving an R² of 0.998301691 for the total dataset, with the lowest RMSE (0.051935903) and MAPE% (0.370554549), showcasing its exceptional ability to model the complex relationships among input features, including bacterial type, culture medium type, initial pH (6–9), time (0–68.27 h), and bacterial cell concentration (0–1.7184 OD600). The EL model followed closely, exhibiting strong performance with an R² of 0.998222719 and low error rates, while the ANN and LSSVM models also showed robust predictive capabilities, maintaining R² values above 0.997 and MAPE% below 0.6. Conversely, the RF and AdaBoost models displayed slightly lower accuracy compared to 1D-CNN and EL but remained within acceptable predictive ranges.
Figure 3 enhances the insights from Table 3 by providing a visual comparison of model performance during the testing phase, likely through bar charts comparing R², RMSE, and MAPE% values across all models. The figure clearly highlights 1D-CNN’s superior predictive precision, with the closest alignment between predicted and experimental pH values for the 76 test points. It also reveals relatively higher error margins for models like DT and AdaBoost compared to 1D-CNN and EL, underscoring the advantages of deep learning and ensemble methods in addressing complex pH dynamics.
Collectively, Table 3; Fig. 3 emphasize the efficacy of advanced artificial intelligence techniques, particularly 1D-CNN, in precisely predicting pH variations in culture media due to bacterial growth. These findings highlight the potential of CSA optimized computational models as reliable, efficient alternatives to conventional experimental methods, providing valuable tools for optimizing biotechnological processes where pH control is critical. Moreover, a standard ordinary least squares linear regression (LR) model was utilized using the same training and test subsets of the ML models. The performance metrics (R², RMSE, MAPE) of the LR model were then compared with those of the ML models and the results are shown in Table 3; Fig. 3. The results demonstrated that while the LR model achieved reasonably good performance, the ML models still outperformed it consistently, particularly in capturing nonlinear patterns and interactions between input features.
Table 3 The obtained values of evaluation indices for all created models with respect to training, testing and total segments.
Fig. 3
MSE, R-squared and MAPE% for all created models in this paper (testing phase).
Figure 4 further complements these findings by illustrating the distribution of absolute relative errors for all machine learning models. The histograms show that most predictions for 1D-CNN and EL models are concentrated in the lowest error bins, confirming their superior accuracy and consistency across the dataset. In contrast, models such as DT and AdaBoost exhibit broader error distributions, reflecting slightly higher prediction variability. The MLP-ANN, LSSVM, and RF models fall between these extremes, maintaining moderate error concentrations. This comparative view highlights the advantages of deep learning and ensemble approaches in minimizing prediction errors and reinforces the performance hierarchy established by the quantitative metrics in Table 3.
Fig. 4
Data frequency versus absolute error intervals for different ML models.
Figure 5 present crossplots comparing predicted versus experimental pH values for culture media influenced by bacterial growth, employing seven distinct artificial intelligence models. These models include 1D-CNN, EL, AdaBoost, DT, RF, ANN, and LSSVM. The analysis is based on a 379-point experimental dataset, split into 303 data points for training and 76 for testing. These crossplots serve as vital visual tools for assessing the predictive performance of each model, with optimal performance indicated by data points tightly clustered along the 45-degree line.
The dataset encompasses three bacterial strains including Pseudomonas pseudoalcaligenes CECT 5344, Pseudomonas putida KT2440, Escherichia coli ATCC 25,922 and cultured in LB and M63 media, with initial pH values ranging from 6 to 9, time intervals from 0 to 68.27 h, OD600 from 0 to 1.7184, and system pH values spanning 4.59 to 9.03. Collectively, Fig. 5 provides a comprehensive visual assessment of the models’ predictive capabilities, with the 1D-CNN model exhibiting exceptional accuracy, demonstrated by the tight alignment of predicted and experimental pH values across all bacterial and media systems. EL and ANN also show robust performance, while models such as DT and AdaBoost display relatively wider scatter, suggesting slightly lower precision.
These crossplots validate the reliability of the 379-point dataset and the effectiveness of the data normalization technique applied, which reduced disparities in input scales and supported stable, accurate model training. Overall, the figures underscore the 1D-CNN model’s superior capacity to capture complex, non-linear relationships between key input features and pH behavior, highlighting its potential for enhancing applications such as microbial process optimization, bioreactor design, and biotechnological advancements.
Fig. 5
Crossplots of estimated pH versus actual values for all machine learning models.
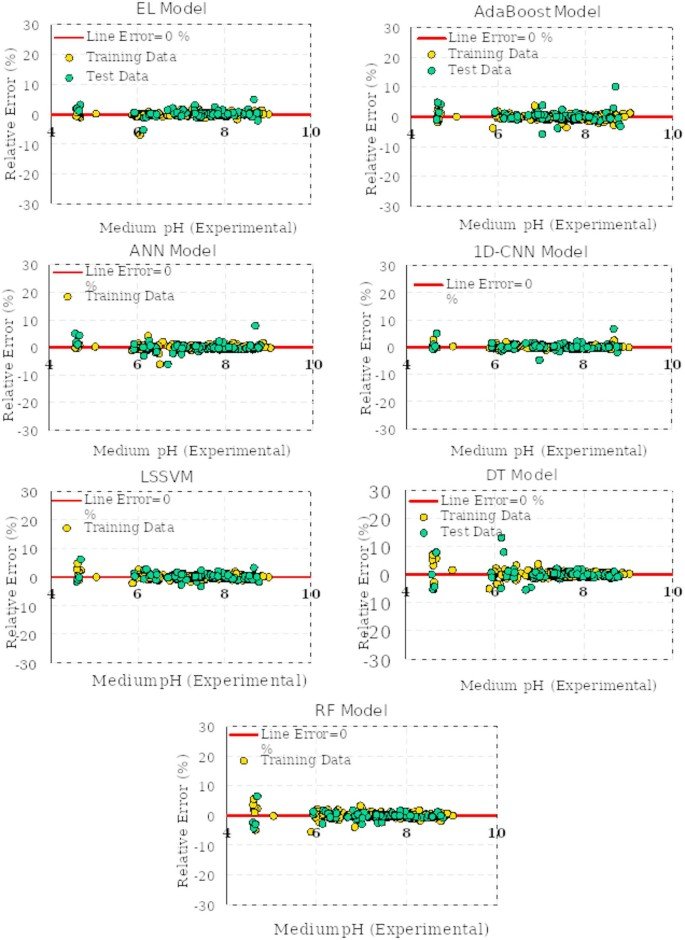
Figure 6 illustrates the relative error percentages during the training and testing phases for seven artificial intelligence models developed to predict pH variations in culture media influenced by bacterial growth. Data points closer to the y = 0 line indicate superior predictive accuracy across the 379-point dataset (303 training points and 76 testing points). Among the models, 1D-CNN exhibits exceptional performance, with the tightest error distribution (MAPE% = 0.370554549, R² = 0.998301691), followed by EL (MAPE% = 0.37966203) and ANN (MAPE% = 0.502705344). In contrast, DT (MAPE% = 0.767710648) and AdaBoost models show wider error ranges. This visual analysis underscores 1D-CNN’s remarkable ability to precisely capture the complex effects of bacterial type, culture medium type, initial pH (6–9), time (0–68.27 h), and bacterial cell concentration (0–1.7184 OD600) on pH behavior, affirming its effectiveness for applications such as microbial process optimization, bioreactor design, and biotechnological advancements.
Fig. 6
Relative error percent for training and testing segment for all the constructed models in this study.
Sensitivity analysis
This section of the study explores the influence of key input variables include bacterial type, culture medium type, initial pH, time, and bacterial cell concentration (OD600) on the pH variations in culture media due to bacterial growth, while evaluating the relative significance of each factor. The importance of these input features is quantified through correlation coefficients, offering insights into their contributions to the pH prediction models developed using 379 experimental data points49.
In this analysis, the Monte Carlo simulation approach, appreciated for its simplicity and clarity, is utilized to assess the relative impact of the input variables on the pH behavior of culture media. It is important to clarify that Monte Carlo simulation in this study is not used to directly predict pH values, but rather to assess the sensitivity of input variables within the trained machine learning models. While Monte Carlo methods can be employed in traditional simulation contexts, they require prior knowledge of system equations and are computationally intensive when applied directly to complex biological processes. In contrast, machine learning models offer a data-driven alternative that can learn from experimental data without requiring explicit mechanistic formulations, providing faster and often more accurate predictions. Therefore, the Monte Carlo method was used to explore the influence of input variables on the output of ML models, not to simulate pH itself. The ML models remain central to the prediction framework, while Monte Carlo simulation supports interpretability and sensitivity analysis. The best model, i.e. 1-D CNN model was coupled with the Monte-Carlo algorithm for determining the most sensitive factors.
Monte Carlo simulation approach excels in managing uncertainties by systematically sampling a wide range of input values, allowing direct evaluation of output variability without dependence on proxy modeling. Within this framework, the model incorporates multiple input parameters, defined as Eq. (17)49:
$$y=f({x_1},{x_2},….,{x_n})=f(x)$$
(17)
The range and distribution properties of each input variable () are established and used to create a comprehensive sampling set as Eq. (18):
Here, k represents the total number of generated samples, and n denotes the number of input features considered. Various sampling techniques, such as random sampling, importance sampling, and Latin hypercube sampling (LHS), may be applied at this stage to construct the input dataset. The model is then executed for each set of sampled inputs to produce the corresponding output results as Eq. (19):
In this context, k indicates the number of samples generated, and n represents the number of input variables. Multiple sampling strategies, including random sampling, importance sampling, and Latin hypercube sampling (LHS), can be employed during this phase. The model is applied to each set of sampled input variables to compute the corresponding output results, as defined in Eqs. (20) and (21):
Here, V and E denote the variance and expected value, respectively. Sensitivity analysis is then performed based on the input-to-output relationship described in Eq. (22). Among the various methods for visualizing this relationship, scatterplot generation is regarded as one of the most straightforward and effective techniques:
$$({x_{ij}},{y_i}),\,i=1,2,…,k$$
(22)
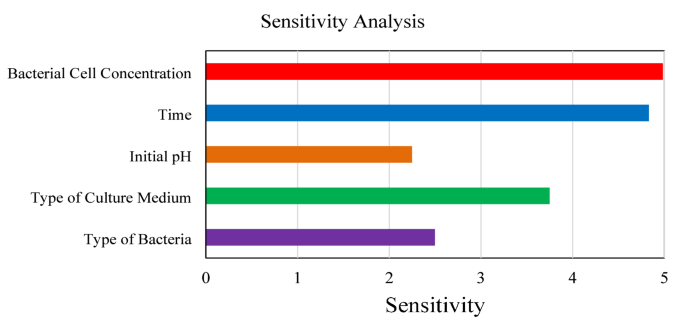
Figure 7 presents a detailed sensitivity analysis assessing the relative influence of bacterial type, culture medium type, initial pH, time, and bacterial cell concentration on the pH behavior of culture media, employing a Monte Carlo simulation integrated with the artificial intelligence models developed in this study. The Monte Carlo method, recognized for its robustness in addressing uncertainties, systematically samples variations in the input parameters to evaluate their impact on pH predictions. The findings are displayed using a correlation matrix or comparable visualization, highlighting both the magnitude and orientation of the associations between each input variable and the resulting pH response.
The analysis identifies bacterial cell concentration as the most influential factor, with a correlation coefficient of 4.9825, underscoring its pivotal role in driving pH variations across the studied systems. Time follows closely, with a correlation coefficient of 4.8312, indicating that the duration of bacterial growth significantly affects pH dynamics. The type of culture medium, with a correlation coefficient of 3.7482, also exerts a substantial influence, suggesting that the media composition plays a critical role in pH changes. Bacterial type and initial pH, with correlation coefficients of 2.4972 and 2.2483, respectively, demonstrate comparatively lesser but still notable impacts.
Based on the analysis of 379 experimental data points, bacterial cell concentration and incubation time were identified as the most influential variables affecting pH changes in the culture media. Other features exhibited weaker correlations, suggesting that microbial metabolism and growth phase primarily drive acidification or alkalization dynamics. The use of Monte Carlo simulation enhances the reliability of this analysis by accounting for input uncertainties, providing a robust basis for understanding the underlying mechanisms. Figure 7 serves as a valuable resource for researchers, offering practical guidance for optimizing microbial processes where pH control is critical for biotechnological applications.
Fig. 7
Assessment of the factors affecting pH variations in culture media due to bacterial growth using the developed predictive models and Monte Carlo simulation.
Temporal analysis of bacterial growth and pH dynamics in LB and M63 media using machine learning modeling
In the context of predictive modeling, a critical aspect is the model’s ability to accurately forecast not only individual data points but also the overall trend of the output variable. In this study, the top-performing model, 1D-CNN, was employed to predict the trend of pH variations in the growth medium during the bacterial growth process for each bacterial strain. The results demonstrate that the developed 1D-CNN model effectively captures this trend, reflecting its capability to simulate the dynamic pH behavior. Moreover, this approach serves as a form of process simulation through the application of intelligent models, providing a reliable tool for understanding and predicting microbial growth dynamics.
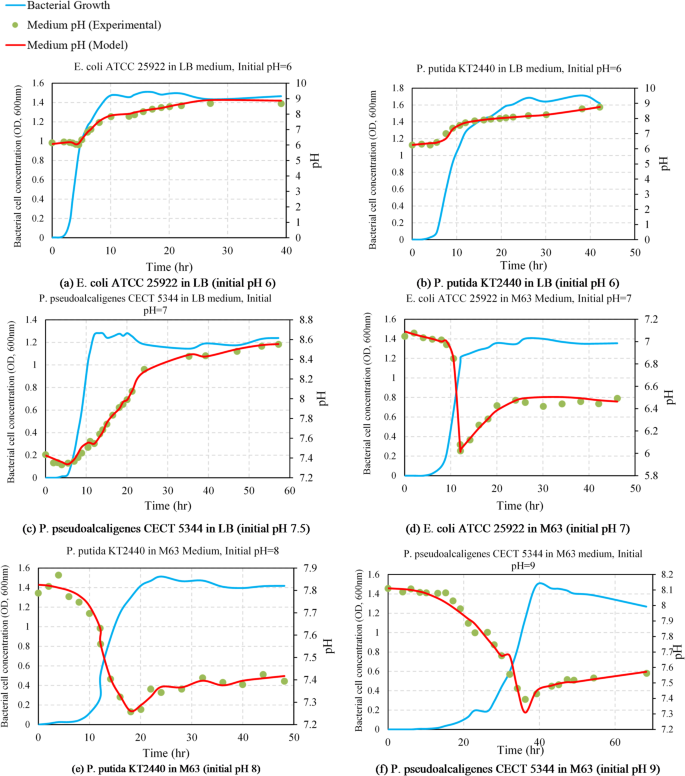
Figure 8 presents a comprehensive overview of the 1D-CNN model’s predictive performance across six distinct bacterial strain–medium combinations. In each subplot (8a–8f), the red line represents the predicted pH trend, the green dots indicate experimentally measured pH values, and the blue line denotes bacterial growth over time (OD600). These experiments reflect different environmental settings and initial pH conditions, demonstrating the model’s ability to generalize across multiple growth scenarios.
Figure 8a shows the results for Escherichia coli ATCC 25,922 cultivated in LB medium with an initial pH of 6. The bacterial growth exhibited a classical sigmoidal pattern, rising from 0.0028 to 1.46 OD600 over ~ 39 h. The predicted pH increased from 6.0 to 8.76, closely aligning with experimental data (6.15–8.69), confirming the model’s high accuracy in alkaline pH forecasting under nutrient-rich conditions. Figure 8b corresponds to Pseudomonas putida KT2440 grown in LB medium (initial pH 6). Growth peaked at 1.62 OD600 in ~ 42 h, and the predicted pH ranged from 6.0 to 8.76. The predictions tightly followed the experimental range (6.25–8.75), demonstrating the model’s robustness in capturing pH elevation due to metabolic activity.
Figure 8c illustrates the growth of Pseudomonas pseudoalcaligenes CECT 5344 in LB medium with an initial pH of 7.5. Here, bacterial growth progressed steadily from 0 to 1.24 OD600 over ~ 57 h. The model accurately predicted a gradual pH increase from 7.43 to 8.55, matching experimental data (7.44–8.55), validating its effectiveness for neutral–alkaline starting conditions. Figure 8d displays results for E. coli ATCC 25,922 cultured in M63 minimal medium starting at pH 7. The bacterial growth reached 1.35 OD600 after ~ 46 h. In contrast to the LB medium results, pH decreased over time, and the model captured this acidification trend, predicting a decline from 7.09 to 6.46, consistent with the measured range (7.05–6.49). This illustrates the 1D-CNN model’s capability to handle both increasing and decreasing pH dynamics. Figure 8e reports the behavior of P. putida KT2440 in M63 medium with an initial pH of 8. The growth curve showed a peak at 1.42 OD600 after ~ 48 h. The model predicted a modest decline in pH from 7.82 to 7.42, accurately reproducing the experimental values (7.79–7.43), suggesting it can model moderate pH shifts under nutrient-limited conditions. Figure 8f shows the dynamics for P. pseudoalcaligenes CECT 5344 in M63 medium with an initial pH of 9. Bacterial growth increased to 1.38 OD600 over ~ 68 h. The model forecasted a steady decrease in pH from 8.11 to 7.52, aligning well with the measured pH trend (8.11–7.56), reinforcing its performance in alkaline environments.
Overall, the 1D-CNN model demonstrated consistent and accurate prediction across a wide spectrum of microbial growth conditions, pH trends (both rising and falling), and media compositions. These results validate the suitability of 1D-CNN for modeling pH dynamics in microbiological systems and reinforce its potential as a non-invasive, data-driven tool for predictive bioprocess monitoring and optimization.
Fig. 8
Comparison between 1D-CNN-predicted and experimental pH values alongside bacterial growth trends for six different bacterial strain–medium combinations.
From a technological perspective, the artificial intelligence framework developed in this study, validated through sensitivity analyses and error distribution assessments, demonstrates promising capabilities for data-driven modeling of microbiological pH variations. While not claiming to establish a universal benchmark, the approach provides a practical example of how machine learning can capture key patterns in moderately complex systems using available experimental data. This work highlights potential applications in biotechnology and microbial process optimization, but further research with larger and more diverse datasets will be required to fully generalize these findings to broader and more intricate biological contexts.
Moreover, the computational efficiency of this methodology supports more sustainable research practices by decreasing reliance on extensive experimental efforts, aligning with modern goals of operational efficiency and environmental responsibility in scientific and industrial settings. However, there are some limitations that should be acknowledged. Needing external validation and independent datasets, lack of interpretability for some of high-performing ML models like ANN and RF and the black box nature of the models, and high computational complexity of some models such as ANN and EL are the main limitations of the current study that need to be addressed in future works.
A computer generated image of what the lunar vehicle could look like on the Moon
In a shopping plaza an hour outside Toronto, flanked by a day spa and a shawarma joint, sits a two-storey building with blue tinted windows reflecting the summer sun.
It is the modest headquarters of Canadensys Aerospace, where Canada is charting its first trip to the Moon.
Canadensys is developing the first-ever Canadian-built rover for exploring the Earth’s only natural satellite, in what will be the first Canadian-led planetary exploration endeavour.
Models, maps and posters of outer space line the office walls, while engineers wearing anti-static coats work on unfamiliar-looking machines.
Sending this rover to the Moon is part of the company’s “broader strategy of really moving humanity off the Earth”, Dr Christian Sallaberger, Canadensys’ president and CEO, told the BBC.
Learning about the Moon – which is seen to have the potential to become a base for further space exploration – is the “logical first step”, he said.
“People get all excited about science fiction films when they come out. You know, Star Wars or Star Trek. This is the real thing.”
Prototypes of the lunar rover, both designed and built by Canadensys
The Canadian vehicle is part of Nasa’s Artemis programme, which aims to establish a sustainable human presence on the Moon.
As part of that overarching goal, this rover aims to find water and measure radiation levels on the lunar surface in preparation for future manned missions, and survive multiple lunar nights (equivalent to about 14 days on Earth).
The rover will also demonstrate Canadian technology, building on Canada’s history in space.
Canada was the third country to launch a satellite, designed the Canadarm robotic arms for the Space Shuttle and the International Space Station, and is known for astronauts such as Chris Hadfield and Jeremy Hansen – the latter of whom will orbit the Moon on the Artemis II mission next year.
The 35kg rover is scheduled to be launched as part of a Nasa initiative in 2029 at the earliest. It will land on the Moon’s south polar region – one of the most inhospitable places on the lunar surface.
The vehicle does not have a name yet. The Canadian Space Agency held an online competition to select one, and is expected to announce the winner in the future.
Canadensys President Christian Sallaberger said he is excited to be playing a role in humanity’s quest to explore space
Canadensys is currently working on several prototypes of the rover. The final vehicle, Mr Sallaberger said, would be assembled shortly before launch.
Each component is tested to ensure it can survive the Moon’s harsh conditions.
Temperature is one of the main obstacles. Lunar nights can plummet to -200C (-328F) and rise to a scorching daytime of 100C (212F).
“It’s one of the biggest engineering challenges we have because it’s not so much even surviving the cold temperature, but swinging between very cold and very hot,” he said.
Designing the wheels is another challenge, as the Moon’s surface is covered with a sticky layer of fragmented rock and dust called regolith.
“Earth dirt, if you look at it microscopically, has been weathered off. It’s more or less in a round shape; but on the Moon the lunar dirt soil is all jagged,” Mr Sallaberger said.
“It’s like Velcro dirt,” he said, noting it “just gums up mechanisms”.
Engineers Misha Hartmann (L) and Adam Abdulahad work on a prototype of the rover at the Canadensys headquarters
The search for water on the lunar surface is especially exciting, considering the Moon was generally thought to be bone dry following the Apollo missions in the 1960s and 70s, the US human spaceflight programme led by Nasa.
That perception changed in 2008, Dr Gordon Osinski, the mission’s chief scientist, told the BBC, when researchers re-analysed some Apollo mission samples and found particles of water.
Around the same time, space crafts observing the Moon detected its presence from orbit.
It has yet to be verified on the ground and many questions remain, the professor at Western University in London, Ontario, said.
“Is it like a patch of ice the size of this table? The size of a hockey rink? Most people think, like in the Arctic, it’s probably more like grains of ice mixed in with the soil,” he said.
Water on the Moon could have huge implications for more sustainable exploration. He noted one of the heaviest things they need to transport is often water, so having a potential supply there would open doors.
Water molecules can also be broken down to obtain hydrogen, which is used in rocket fuel. Mr Osinski described a future where the Moon could become a sort of petrol station for spacecrafts.
“It gets more in the realms of sci- fi,” he said.
Dr Osinski, an expert in lunar geology and has experience training astronauts in Canada’s Arctic, showed off a lunar rock during the BBC interview
Canada has wanted to build a lunar surface vehicle for decades, with talk of a Canadian-made spacecraft even in the early 2000s – but it was not until 2019 that concrete plans were announced.
Canadensys was awarded the C$4.7m ($3.4m; £2.5m) contract three years later.
Founded in 2013, Canadensys has worked on a variety of aerospace projects for organisations like Nasa and the Canadian Space Agency, as well as commercial clients.
More than 20 instruments built by the company have been used in a host of missions on the Moon.
But there are challenges ahead – as even landing on the Moon is no easy feat.
In March, a spacecraft by commercial US firm Intuitive Machines toppled over onto its side during landing, ending the mission prematurely.
Three months later, Japanese company iSpace’s Resilience lost touch with Earth during its landing, and eventually failed.
“That’s the nature of the business we’re in,” Mr Sallaberger said. “Things do go wrong, and we try to do the best we can to mitigate that.”
Intuitive Machines/The Planetary Society
A picture of the Earth taken by a Canadensys-built camera was selected as the Best Space Exploration Image of 2024 by the Planetary Society
Space exploration has been a collaborative field over the years, with countries – even rivals, such as the United States and Russia – working together on the International Space Station.
But that might be changing, Mr Osinski said. As the prospect of a permanent presence on the Moon becomes more realistic, wider geopolitical questions have begun to swirl around the ownership of the satellite.
“There’s more talk around who owns the Moon and space resources,” Mr Osinski said.
In 2021, the US passed a law to protect the Apollo Moon landing site “because they had a concern that China could just go and grab the US flag, or take a piece of an Apollo lander”, he said.
But he had some encouraging words about the Artemis missions, which are “even way more international than the space station”.
The Artemis Accords, which is a set of ideals to promote sustainable and peaceful exploration of outer space, has been signed by more than 50 countries – including ones like Uruguay, Estonia and Rwanda, which are not traditionally seen as key space race nations.
Space is also becoming more accessible. Private companies like SpaceX and Blue Origin have taken an increasingly important role and are able to take anyone with the money and barely any training – like Amazon founder Jeff Bezos and pop star Katy Perry – into space for a few minutes.
But the Moon is the Holy Grail, as it opens up all sorts of possibilities.
Mr Sallaberger said that Canadensys is involved in longer-term projects, such as lunar greenhouses for food production.
Those still remain many years in the future, but the rover is a starting point.
“If you design something that can survive on the lunar surface long-term, you’re pretty bulletproof anywhere else in the solar system.”
A team of researchers at Maharshi Dayanand University (MDU), Rohtak, has developed an artificial intelligence (AI)-based tool capable of detecting diseases and nutrient deficiencies in bitter gourd leaves, potentially transforming the way farmers monitor crop health.
The study, recently published in the peer-reviewed journal ‘Current Plant Biology’ (Elsevier), highlights how AI-driven innovations can play a crucial role in real-time crop monitoring and precision farming.
The newly developed web-based application, named ‘AgriCure’, is powered by a layered augmentation-enhanced deep learning model. It allows farmers to diagnose crop health by simply uploading or capturing a photograph of a leaf using a smartphone.
“Unlike traditional methods, which are time-consuming and often require expert intervention, AgriCure instantly analyses the image to determine whether the plant is suffering from a disease or nutrient deficiency, and then offers corrective suggestions,” explained the researchers.
The collaborative research project was led by Dr Kamaldeep Joshi, Dr Rainu Nandal and Dr Yogesh Kumar, along with students Sumit Kumar and Varun Kumar from MDU’s University Institute of Engineering and Technology (UIET). It also involved Prof Narendra Tuteja from the International Centre for Genetic Engineering and Biotechnology (ICGEB), New Delhi and Prof Ritu Gill and Prof Sarvajeet Singh Gill from MDU’s Centre for Biotechnology.
MDU Vice-Chancellor, Prof Rajbir Singh, congratulated the research team on their achievement.
According to the researchers, AgriCure can detect major diseases such as downy mildew, leaf spot, and jassid infestation, as well as key nutrient deficiencies like nitrogen, potassium and magnesium.
“This represents a step towards sustainable agriculture, where AI empowers farmers with real-time decision-making tools,” said corresponding authors Prof Ritu Gill and Prof Sarvajeet Singh Gill. They added that the web-based platform can be integrated with mobile devices for direct use in the field.
The team believes that the technology’s core framework can be extended to other crops such as cereals, legumes, and fruits, creating opportunities for wider applications across Indian agriculture.
Looking ahead, they plan to integrate AgriCure with drones and Internet of Things (IoT) devices for large-scale monitoring, and to develop lighter versions of the model for full offline use on mobile phones.
Competition to introduce AI to the diplomatic front lines of major countries The U.S. actively utilizes the State Department’s exclusive “State Chat” to brainstorm foreign policy. Canada uses it to analyze major countries’ policies
[Photo = Yonhap News]
Competition to introduce artificial intelligence (AI) is fierce not only in industrial areas but also in diplomacy, which is the front line of competition between countries. The U.S. State Department is increasing the work efficiency of diplomats through its own AI. Japan spends more than 600 billion won a year to detect false information. The move is aimed at preventing the possibility that fake information will be misused to establish national diplomatic strategies.
In the United States, the State Department has been operating its own AI ‘State Chat’ since last year. It is an interactive AI in the form of ‘Chat GPT’, similar to the method promoted by the Korean Ministry of Foreign Affairs. It provides functions such as summarizing internal business documents and professional analysis. E-mails used by diplomats are also drafted according to the format and even have the function of helping “brainstorming” in relation to foreign policy or strategy.
StateChat is dramatically reducing the amount of time State Department employees spend on mechanical tasks. According to State Department estimates, the total amount of time saved by all employees through their own AI amounts to 20,000 to 30,000 hours per week.
The State Department plans to continue expanding the use of StateChat. State Chat is also used for job training. This is due to the advantage of minimizing information that may be omitted during the handover process and enabling in-depth learning by providing data containing stories. State Chat will also be used to manage manpower. Information related to personnel management is also entered in State Chat.
[Photo = Yonhap News]
Japan has been building a situation analysis system using AI since 2022. AI finally judges the situation by combining reports from local diplomats with external information such as foreign social network service (SNS) posts, reports from research institutes, and media reports. For example, if social media analysis detects residents’ disturbance in a specific area, AI warns of the risk of terrorism or riots.
From 2023, it is using AI to detect fake news that is mainly spread through SNS. It analyzes not only text but also various media types of content such as images, audio, and video. It is a method of measuring the consistency of information based on a large language model (LLM) and then determining whether it is false. In particular, Japan calculates and presents the social impact, such as the scale and influence of the fake news.
Japan believes that numerous fake news after the Fukushima nuclear power plant accident has undermined national trust and caused unnecessary diplomatic friction. Japan allocated about 66.2 billion yen (626.5 billion won) in the fiscal 2025 budget to the policy and technology sectors to respond to false information.
Canada introduced a ‘briefing note’ using Generative AI in 2022. A draft policy briefing document is created by analyzing and reviewing policy-related data of major countries. Finland operates a system that collects diplomatic documents through AI and summarizes them on its own, and even visualization functions are provided. The UK has introduced AI to consular services. Classify the services frequently requested by their citizens staying abroad to overseas missions and provide optimal answers.
Last year, France developed an AI tool that summarizes and analyzes diplomatic documents and external data and is using it to detect ‘reverse information (fake news or false information)’ overseas and to identify public opinion trends. The United Arab Emirates (UAE) has introduced an unmanned overseas mission model that provides consular services based on AI.


![[Photo = Yonhap News]](https://aistoriz.com/wp-content/uploads/2025/08/news-p.v1.20250831.e738e78a131544a38de88cd64aaced2a_P1.jpg)


