Tools & Platforms
AI image enhancement for failure analysis in 3D quantum information technology
SAM measurement and data generation
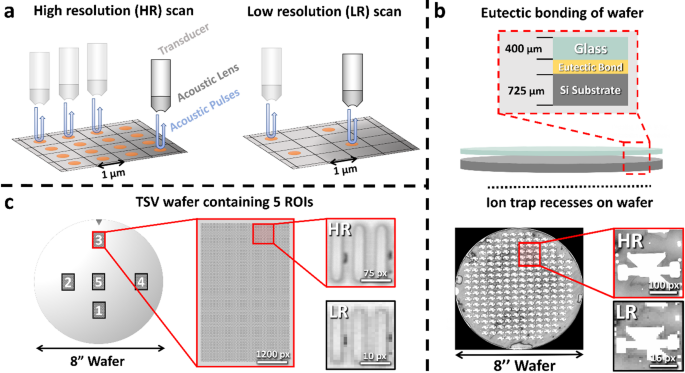
We utilize C-Scan SAM to generate the experimental data. Figure 1a shows the basic working principle of a SAM device. The transducer produces acoustic pulses which are focused via an appropriate lens onto the sample. From the intensity and travel time of the reflected acoustic waves, information on structure and possible defects are extracted. Additionally, the scanning resolution of the SAM device can be lowered, resulting in a smaller resolution while speeding up the measurement time. Furthermore, the effective resolution depends on the frequency of the acoustic waves used37.
In this study, we exemplary investigate two specimens with two different 3D integrated technology-based building blocks on wafer level, crucial for the upscaling of trapped-ion QC devices. Figure 1b-c, illustrate the basic structure of the analyzed specimens. Further magnified C-scan images with different resolutions are provided. The first specimen, as shown in Fig. 1b, is fabricated by combining a fully metallized unstructured silicon as well as a glass substrate via eutectic bonding26 creating partly a MEMS based symmetrical 3D architecture providing more reliable trapping of the ions60, see Method section for further details. The ion trap recess is indicated on top of the wafer surface. We measure this wafer from the silicon side with two resolutions, namely with 300 μm/px and 50 μm/px. For this, we utilize a piezo-electric transducer with a focus length of 8 mm, finally permitting a center frequency of 209 MHz at the specimen. The focus for the C-scan SAM image is selected to be at the Si-eutectic interface at 5400 nanoseconds time-of-flight. Details with respect to time signal or A-scan are presented in Supplementary Note 1 and Supplementary Fig. 1.
The C-scan SAM image exhibits different grey values, which can be associated with the underlying different material phases and defect types originating from the eutectic bond between the wafers as well as delaminated areas. However, while the high-resolution (HR) 50 μm/px C-scan image displays sharp edges and good phase contrast, the low-resolution (LR) 300 μm/px image is pixelated and phases are harder to distinguish. This is especially problematic for resolution and contrast sensitive image analysis algorithms like object-detection and segmentation. In the utilized setting, the measurement of the 50 μm/px image takes around 6x longer than for the 300 μm/px image, due to its higher resolution. To leverage this problem and combine the high quality of the 50 μm/px image with the low scanning times of the 300 μm/px image, AI-based image enhancement will be used.
The second specimen, displayed in Fig. 1c, contains 10,240 TSVs per ROI. For a precise measurement of the TSV structure, which exhibits an extension of only about 8 pixels, we utilize a tone-burst setup, see Method section for further details. The center frequency of the transducer is 200 MHz, resulting in a frequency of about 205 MHz at the surface. The focus of the acoustic waves was selected to be at the surface of the wafer at around 1315 ns time-of-flight, the opening angle of the utilized lens in the transducer is 60°. For scanning the ROIs, a resolution of 2 μm/px was chosen. Using a resolution of 1 μm/px approximately quadruples the time needed, if all other scanning parameters stay the same. Hence, image enhancement is used to speed-up measurements by using a lower scanner resolution and simultaneously enhance the accuracy of object detection on those images. Further details regarding the specimens and setup are presented in the Method section and Supplementary Fig. 1.
Scanning principle of a SAM and two different QC 3D integration technology specimens. (a) Scanning principle of SAM. To obtain a HR image, the transducer sends out and receives acoustic pulses at many scanning points. When using a low resolution, the transducer excites fewer pulses resulting in a shorter scanning time. (b) For the first specimen, a schematic of a bonded wafer is illustrated. A glass and unstructured silicon substrate, both fully metallized, are bonded together via eutectic bonding. A SAM C-scan image from the whole wafer containing the ion trap recesses (white grey values) is shown. Further grey values within the image can be associated with different qualities of the eutectic bond (light grey) and delamination (white and dark grey). Two magnified C-scan images for the same region of interest (ROI) are displayed on the right. They are indicated as HR and LR. (c) The second specimen shows a wafer with five TSV structures, each ROI exhibits 10,240 TSVs. The ROIs are highlighted with the numbers 1 to 5. A magnified image of ROI 3 is presented. A further zoom-in on the right highlights the TSV’s structure. HR and LR C-scan images are indicated. Winsam 8.24 software61 is employed for capturing and preprocessing the C-scan images.
Workflow—From data acquisition over image enhancement to failure analysis
The overall workflow for super resolution (SR) and the downstream image analysis is shown in Fig. 2. It consists of three stages including model selection, data acquisition and preprocessing, self-supervised learning and application of the trained SR model to resolution sensitive failure-analysis tasks, see Fig. 2a-c, respectively.
As depicted in Fig. 2a, a SR model architecture and learning strategy has to be chosen. This can be a supervised CNN like DCSCN, a SR-GAN or an iterative algorithm like InDI. Additionally, high resolution image data has to be collected by using SAM. C-scan images are then preprocessed by cropping and augmentation.
Inspired by ideas of current self-supervised real-world SR approaches50,62 the augmented HR images are then downscaled by nearest-neighbors to produce the corresponding LR counterparts. Using a simple nearest-neighbors downscaling is justified by the fact that reducing the SAM scanning resolution is physically similar to deleting every second pixel in the image. To further ensure that the downscaled LR images looks realistic, multiplicative noise has to be added, since this is a common source of degradation in acoustic microscopy39. Lastly, we also employ Gaussian blurring and WebP compression to make the architecture more resilient to other degradation mechanisms. Multiplicative noise is applied with a probability of 30% and Gaussian blur as well as compression-noise is applied with a probability of 10% to every image. Details about training parameters and datasets used are available in the Methods section.
As can be seen in Fig. 2b, we use the final LR images as input to an exemplary SR model, which outputs images with higher-resolution. Image quality can now be measured in terms of a loss function to guide the training of the exemplary model. Nevertheless, this loss function can be chosen freely and the main problem comes down to avoiding regression-to-the mean, which causes blurry and less sharp image reconstructions63.
Depending on the quality and amount of training data, the SR model can now enhance various real-world images, see Fig. 2c. The models are trained on a wide variety of C-scans, enabling them to perform well on a large range of images including different resolutions and transducer types, see Methods section for more information. The enhanced images are then used for resolution-sensitive downstream tasks like semantic segmentation or object detection, often enabling improved performance due to higher image fidelity.
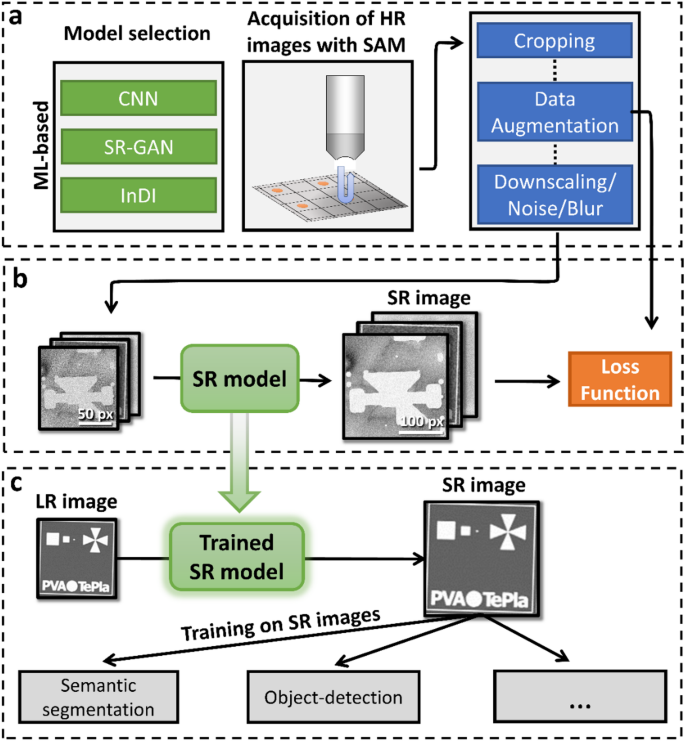
Overview of the super-resolution workflow. (a) The first step of the workflow consists out of model selection and data acquisition via SAM. The obtained C-scan images are cropped and augmented. To do self-supervised training, LR images are constructed by downscaling and altering the augmented HR images. (b) Training of the chosen model architecture utilizing the downscaled images. A predefined loss function guides the model training. (c) After training is complete, the model can be applied to enhance various other images. Further, the enhanced images can be used to improve the performance of subsequent resolution-sensitive algorithms like semantic segmentation or object-detection. Winsam 8.24 software61 is employed for capturing and preprocessing the C-scan images.
Model selection and validation for image enhancement
For image enhancement we train various modern ML-based SR architectures and compare them to classical methods, see also Table 1. The developed image enhancement shall foster to eliminate time limitations fetched by the experimental HR scans by doubling the resolution after measurement, as shown in Fig. 3. Most importantly, the SR approach should also generalize to various scanning resolutions and transducer types. To achieve this, self-supervised model training is implemented, allowing to train on much larger dataset and improving generalizability. Moreover, the ML-models are discussed not only based on the performance gained by known metrics but also by their evaluation time per image as well as energy consumption.
One can quantify the reconstruction quality of different models by calculating common metrics like the peak signal-to-noise-ratio (PSNR) and structural similarity index measure (SSIM)63,64. Both allow a comparison to other models found in literature. However, these two metrics are sensitive to small image transformations and do not capture important image characteristics like sharp edges44,63,65. Therefore, they do not present useful objectives for measuring overall real-world performance, and we aim to introduce two new metrics which try to capture more of the physical information. The first metric is called edge correlation index (EdgeC). It uses a canny edge detection algorithm to detect edges and calculates the correlation function between the detected edges in the HR and reconstructed image. Possible values of EdgeC range from + 1 to -1, corresponding to perfect correlation or anti-correlation. Furthermore, we introduce a metric based on the scale-invariant feature transform (SIFT) algorithm66,67. SIFT is a popular method to find congruent points in two images. We can employ this algorithm and count how many congruent points SIFT detects between both images. The higher the count, the better the reconstruction. More details about these metrics are presented in the Supplementary Note 2, Supplementary Fig. 2 and Supplementary Table 1.
Table 1 indicates the performance of bicubic and nearest neighbor upscaling in terms of the self-supervised regime, where the LR images are produced by artificially downscaling HR C-scan images. It is obvious that bicubic and nearest-neighbor upscaling perform poorly in terms of the introduced metrics. Nevertheless, when using AI-based models, there are several possibilities for selecting the loss function and training, leading to better reconstruction quality.
One common approach to achieve high-quality outputs is by the use of GANs. To test the capabilities of GAN models for the SR tasks, we implement a SR-GAN41. The generator has the same architecture as displayed in Fig. 3a and is trained with a combination of perceptual loss and adversarial loss, the latter representing the feedback from the discriminator. The discriminator itself is trained using a relativistic average loss68. As shown in Table 1 this SR-GAN approach shows better performance than classical models across all metrics.
Another way to produce high-quality images is by using an iterative algorithm. For this, we implement the recent inversion by direct iteration (InDI) diffusion-like algorithm, which uses a LR image and gradually increases its quality step by step43. As seen in Table 1 InDI performs good for artificially downscaled image data. However, InDI shows issues for the measured low resolution SAM image data, see Fig. 3b-c. There, real measurements of a wafer with test-structures, obtained with 50 μm/px and 100 μm/px resolution directly on the SAM, are shown. It is noticeable that the InDI algorithm is not able to reconstruct the straight lines in ROI-2 from the 100 μm/px image. Additionally, the InDI model hallucinates structures which are not there in the real HR image, as can be seen close to the edges of the cross in ROI-1. This further underscores the importance for real-world evaluations, especially for highly generative and iterative models like InDI. In fact, the problem of hallucinations in highly generative models is gaining increasing attention in the last years51,52. Similar comparisons on real-world data using the SR-GAN model can be found in Supplementary Note 3 and Supplementary Fig. 3.
Perceptual loss functions46 are another common way to produce high-quality outputs in SR tasks. We chose to implement such a perceptual loss function, employing a feature extraction neural network for extracting important features and structure from the image. The mean-averaged-error (MAE) is then calculated between those extracted features, see Method section for further details. With this loss function, the state-of-the-art SRResNet (Super Resolution Residual Network)40 is implemented, which gives results close to SR-GAN and InDI in Table 1. However, when applied to real-world data, the SRResNet performs only slightly better than bicubic upscaling, as demonstrated in Supplementary Fig. 3.
Last but not least, we also implement a more complex fully convolutional neural network based on an adapted DCSCN architecture42 trained with the same perceptual loss as SRResNet. The DCSCN architecture is exemplarily shown in Fig. 3b. Surprisingly, this model shows the best performance across nearly all metrics presented in Table 1, even outperforming the generative models like SR-GAN and InDI, as well as the SRResNet. Furthermore, DCSCN is superior to other methods under real-world applications, as displayed in Fig. 3c and Supplementary Fig. 3.
Table 1 also includes data for the evaluation time and energy consumption during training. To train the diffusion-like InDI and generative SR-GAN models, more powerful hardware has to be used, which also increases the energy consumption and environmental footprint by a factor of around two. Due to its larger parameter size and iterative approach, InDI also takes roughly one order of magnitude longer to reconstruct images. In fact, DCSCN seems to present the best balance between image quality, evaluation time and power consumption.
Detailed information about the SR-GAN, InDI, SRResNet and DCSCN architectures and training can be found in the Methods section, Supplementary Note 4 and Supplementary Fig. 4.

DCSCN model architecture and model evaluation of DCSCN and InDI SR. (a) Model architecture of CNN-based DCSCN SR model. The first block consists out of convolutional layers with 176, 160, 144, 128, 112, 96, 80, 64, 48 and 32 filters. The second block (reconstruction block) is split in two. It has convolutional layers with 32 and 32, 64 filters. The kernel size is 3 except for the first layers in the reconstruction block, where we use a kernel size of 1 for feature extraction. (c) Evaluation of SR on a test wafer. The upper left image shows an overview of the test structures. The colored images are zoomed in sections (ROI 1–2). ROI 1–2 are measured and displayed for different resolutions (100 μm/px and 50 μm/px). From the 100 μm/px we reconstruct a 50 μm/px image with bicubic interpolation, DCSCN and InDI. (d) PSNR, SSIM, EdgeC and the number of matched features found via a SIFT algorithm are listed as bar graphs. They show a clear advantage of the DCSCN approach compared to classical bicubic upscaling, but close to no improvement when using InDI. Winsam 8.24 software61 is employed for capturing and preprocessing the C-scan images.
Failure-analysis of a bonded ion trap wafer
To test the capabilities of SR in industrial applications, we apply the selected CNN-based DCSCN model to the eutectically bonded wafer specimen displayed in Figs. 1b and 4a. The main goal is to show how SR can decrease the time for large-scale SAM measurements and improve the accuracy of subsequent segmentation-based failure analysis.
We again note that C-scan images of the wafer with 50 μm/px and 300 μm/px resolution are available, whereas the 300 μm/px resolution is close to the resolution limit for detecting small features. Different structures, material phases and defect types are visible in the C-scan image, see also Methods section. To quantify the bond quality of the wafer, the scanned images are segmented into 3 distinct regions and the corresponding areas are evaluated, see Fig. 4a. In particular, we distinguish between ion-trap recesses (white), intact eutectic bond (blue) and delaminated eutectic bond (red). For segmentation, three separate state-of-the-art residual attention U-Net69 models, for the three different resolutions (50 μm/px, 300 μm/px and DCSCN enhanced), are trained and employed. More information on the training for the segmentation model is provided in the Methods section.
In Fig. 4b a cutout of the segmented C-scans for a resolution of 50 μm/px, 300 μm/px as well as the DCSCN-enhance image are presented. Clearly, deviations between all images can be depicted, especially between the 300 μm/px and 50 μm/px images. In hard to segment areas, like for the upper ion-trap recess in Fig. 4b, the U-Net segmentation model trained on the 300 μm/px image struggles to detect the whole ion-trap structure. In comparison, even though the DCSCN enhanced image seems to be smoothened and loses some details in comparison to the 50 μm/px image, it is obvious that there is a better qualitative correspondence and all key features are properly segmented in this case.
Figure 4c provides a quantitative comparison of the relative errors in segmented areas between the 50 μm/px, 300 μm/px, DCSCN-enhanced image and a manually labeled ground truth. When applying the DCSCN model to the 300 μm/px image, a decrease of the relative error by at least 10% or more can be established. There are three main reasons for the observed improvement. First, the LR 300 μm/px image is pixelated, leading to lower-details in fine structure and, therefore, a different area of the phases. Second, manual labeling of the LR image for subsequent training of the U-Net is more difficult due to the decreased edge-contrast, making it harder to accurately train the model. Third, when a model is trained with LR data, it has a lower amount of pixel-data to be trained with. For example, the 300 μm/px image has 36 times less pixels then the 50 μm/px image, decreasing model performance and generalizability. All these three factors can be improved by applying super-resolution before manual labeling and model training. Also, according to this reasoning, the provided findings are general and carry over to different model architectures as presented in the Supplementary Note 5 and Supplementary Table 2.

Bond quality evaluation of an eutectically bonded ion trap wafer. (a) Demonstration of ML-based segmentation using a residual attention U-Net. Three classes are distinguished: ion-trap recesses (white), intact eutectic bond (blue) and delaminated/incomplete bond (red). (b) Magnified area of the segmented wafer with a resolution of 50 μm/px, 300 μm/px and an image illustrating 300 μm/px with the applied DCSCN model, from top to bottom. Significant deviations of the 300 μm/px image from the 50 μm/px image are indicated by dashed black circles. Clearly the DCSCN and 50 μm/px images indicate higher similarity. (c) Relative errors in various segmented phases when compared to the manually labeled ground truth for the 50 μm/px, 300 μm/px and DCSCN-enhanced image. Winsam 8.24 software61 is employed for capturing and preprocessing the C-scan images.
Fast object detection and super-resolution for through-silicon-vias (TSVs)
For the failure analysis of thousands of TSVs, we localize and classify every individual TSV on the wafer, see also Fig. 1c. We implement and compare different ML-based object detection algorithms including YOLOv270 and YOLOv1271. YOLO is a so-called one-shot method, since it localizes and classifies all objects in an image within one evaluation of the neural network. This makes the method very time efficient, especially for large images.
Figure 5a shows the basic steps of the failure analysis workflow. The workflow starts by applying SR to the input image to double its size, then dividing it into a grid of cells. For YOLOv2, cells with a size of 32 × 32 pixels are usually used. For every grid cell, a neural-network then predicts three values namely, (1) a confidence score, which measures the probability of an object being present in the cell, (2) the bounding box coordinates of the object and (3) its class labels. Finally, non-maximum suppression (NMS) is used to filter out overlapping boxes with low confidence score and a statistical evaluation can be carried out.
In Fig. 5b three quality classes for the TSVs are defined. The first class contains fully intact TSVs without any sort of defect or other imperfection. The second class defines defective TSVs. This category is characterized by black or white imperfections around the edges of the TSV. The third class covers TSVs where a failure cannot be ruled out completely, e.g. they are prone to be impacted in functionality. These TSVs have a defect close to their boundary, however, the defect does not touch the TSV itself.
As a matter of fact, detecting small objects, like the TSVs shown in Fig. 5, displays critical problem for every object-detection algorithm59. Table 2 shows that all tested object detection algorithms show increased performance when trained and evaluated on the DCSCN-enhanced SR images and perform worse when trained and evaluated on the original LR images. The YOLOv2 algorithm is not even able to converge to a proper state, since its cell size is 32 × 32 pixels, limiting the model to only distinguish between objects with a minimum distance of 32 pixels. However, the TSVs illustrated in the C-scan image data have a distance of 25 px, therefore, being too close for YOLOv2 to distinguish. In contrast to this, YOLOv12, which uses multi-scale training and smaller cell sizes, is still able to localize and classify TSVs on the LR images, however, with reduced accuracy. In fact, detection accuracy for both, YOLOv2 and YOLOv12, reaches 99.8% on the SR images. This means, that only 2 out of one thousand TSVs are not detected.
The classification accuracy for sorting the TSVs into the three classes defined in Fig. 5b is evaluated to be around 96% for all models trained on the SR images, and thus close to the capabilities of the approach presented in34, however with higher time efficiency. For example, the evaluation of 10,240 TSVs takes only around 8 s for YOLOv2. To further emphasize the time-efficiency of the YOLO model, we compare it to the recently introduced end-to-end sliding window approach34 by applying it to the data provided in34, see Supplementary Note 6 and Supplementary Fig. 5. Note that the presented YOLOv2-based model architecture outperforms, in terms of time, the mentioned end-to-end sliding window approach34 by a factor of 60.
Table 2 also includes a transformer based Real-Time Detection Transformer (RT-DETR) object-detection model56. Even though this model performs good for the SR images, it underperforms in terms of detection accuracy compared to YOLOv12 on the original LR images. Also, since RT-DETR is transformer-based, model inference can only be applied on images of the same size as the training images. This is a drastic practical shortcoming since object-detection is often trained on small image crops and then applied to larger images. See the Methods section for more details.
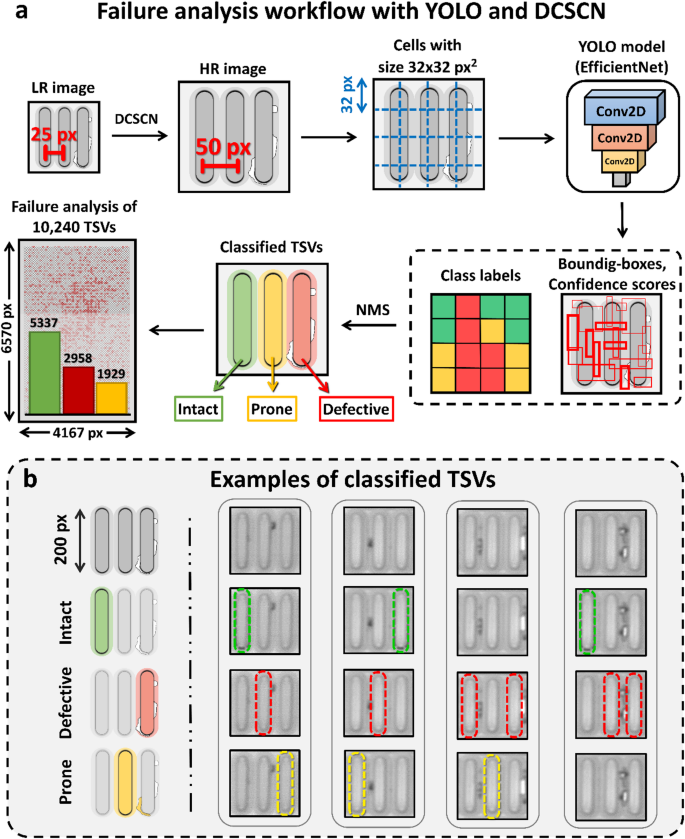
Workflow to enable YOLO object detection with SR and definition of defect labeling. (a) YOLOv2 object detection pipeline. We start by increasing the resolution of the LR scanned image by 2 times, to increase the distance between adjacent TSVs. After that, the HR image is divided into cells of 32 × 32 pixels and evaluated by the YOLO model. The YOLO model utilizes an EfficientNetV2-B0 backbone. The outputs of the model are class labels, bounding boxes and confidence scores for every grid cell. In a last step, NMS is used to filter out intersecting boxes with low confidence. This algorithm can now be used to carry out large scale failure analysis as shown for a ROI containing 10,240 TSVs. (b) TSV classification and measurements. We sort TSVs in three classes: Intact TSVs (green), defective TSVs (red) and TSVs which are prone to be impacted in functionality due to nearby defects (yellow). Winsam 8.24 software61 is employed for capturing and preprocessing the C-scan images.


By JOCELYN GECKER
Associated Press
The book report is now a thing of the past. Take-home tests and essays are becoming obsolete.
Student use of artificial intelligence has become so prevalent, high school and college educators say, that to assign writing outside of the classroom is like asking students to cheat.
“The cheating is off the charts. It’s the worst I’ve seen in my entire career,” says Casey Cuny, who has taught English for 23 years. Educators are no longer wondering if students will outsource schoolwork to AI chatbots. “Anything you send home, you have to assume is being AI’ed.”
The question now is how schools can adapt, because many of the teaching and assessment tools that have been used for generations are no longer effective. As AI technology rapidly improves and becomes more entwined with daily life, it is transforming how students learn and study and how teachers teach, and it’s creating new confusion over what constitutes academic dishonesty.
“We have to ask ourselves, what is cheating?” says Cuny, a 2024 recipient of California’s Teacher of the Year award. “Because I think the lines are getting blurred.”
Cuny’s students at Valencia High School in southern California now do most writing in class. He monitors student laptop screens from his desktop, using software that lets him “lock down” their screens or block access to certain sites. He’s also integrating AI into his lessons and teaching students how to use AI as a study aid “to get kids learning with AI instead of cheating with AI.”
In rural Oregon, high school teacher Kelly Gibson has made a similar shift to in-class writing. She is also incorporating more verbal assessments to have students talk through their understanding of assigned reading.
“I used to give a writing prompt and say, ‘In two weeks, I want a five-paragraph essay,’” says Gibson. “These days, I can’t do that. That’s almost begging teenagers to cheat.”
Take, for example, a once typical high school English assignment: Write an essay that explains the relevance of social class in “The Great Gatsby.” Many students say their first instinct is now to ask ChatGPT for help “brainstorming.” Within seconds, ChatGPT yields a list of essay ideas, plus examples and quotes to back them up. The chatbot ends by asking if it can do more: “Would you like help writing any part of the essay? I can help you draft an introduction or outline a paragraph!”
Students are uncertain when AI usage is out of bounds
Students say they often turn to AI with good intentions for things like research, editing or help reading difficult texts. But AI offers unprecedented temptation, and it’s sometimes hard to know where to draw the line.
College sophomore Lily Brown, a psychology major at an East Coast liberal arts school, relies on ChatGPT to help outline essays because she struggles putting the pieces together herself. ChatGPT also helped her through a freshman philosophy class, where assigned reading “felt like a different language” until she read AI summaries of the texts.
“Sometimes I feel bad using ChatGPT to summarize reading, because I wonder, is this cheating? Is helping me form outlines cheating? If I write an essay in my own words and ask how to improve it, or when it starts to edit my essay, is that cheating?”
Her class syllabi say things like: “Don’t use AI to write essays and to form thoughts,” she says, but that leaves a lot of grey area. Students say they often shy away from asking teachers for clarity because admitting to any AI use could flag them as a cheater.
Schools tend to leave AI policies to teachers, which often means that rules vary widely within the same school. Some educators, for example, welcome the use of Grammarly.com, an AI-powered writing assistant, to check grammar. Others forbid it, noting the tool also offers to rewrite sentences.
“Whether you can use AI or not depends on each classroom. That can get confusing,” says Valencia 11th grader Jolie Lahey. She credits Cuny with teaching her sophomore English class a variety of AI skills like how to upload study guides to ChatGPT and have the chatbot quiz them, and then explain problems they got wrong.
But this year, her teachers have strict “No AI” policies. “It’s such a helpful tool. And if we’re not allowed to use it that just doesn’t make sense,” Lahey says. “It feels outdated.”
Schools are introducing guidelines, gradually
Many schools initially banned use of AI after ChatGPT launched in late 2022. But views on the role of artificial intelligence in education have shifted dramatically. The term “AI literacy” has become a buzzword of the back-to-school season, with a focus on how to balance the strengths of AI with its risks and challenges.
Over the summer, several colleges and universities convened their AI task forces to draft more detailed guidelines or provide faculty with new instructions.
The University of California, Berkeley emailed all faculty new AI guidance that instructs them to “include a clear statement on their syllabus about course expectations” around AI use. The guidance offered language for three sample syllabus statements — for courses that require AI, ban AI in and out of class, or allow some AI use.
“In the absence of such a statement, students may be more likely to use these technologies inappropriately,” the email said, stressing that AI is “creating new confusion about what might constitute legitimate methods for completing student work.”
Carnegie Mellon University has seen a huge uptick in academic responsibility violations due to AI, but often students aren’t aware they’ve done anything wrong, says Rebekah Fitzsimmons, chair of the AI faculty advising committee at the university’s Heinz College of Information Systems and Public Policy.
For example, one student who is learning English wrote an assignment in his native language and used DeepL, an AI-powered translation tool, to translate his work to English. But he didn’t realize the platform also altered his language, which was flagged by an AI detector.
Enforcing academic integrity policies has become more complicated, since use of AI is hard to spot and even harder to prove, Fitzsimmons said. Faculty are allowed flexibility when they believe a student has unintentionally crossed a line, but are now more hesitant to point out violations because they don’t want to accuse students unfairly. Students worry that if they are falsely accused, there is no way to prove their innocence.
Over the summer, Fitzsimmons helped draft detailed new guidelines for students and faculty that strive to create more clarity. Faculty have been told a blanket ban on AI “is not a viable policy” unless instructors make changes to the way they teach and assess students. A lot of faculty are doing away with take-home exams. Some have returned to pen and paper tests in class, she said, and others have moved to “flipped classrooms,” where homework is done in class.
Emily DeJeu, who teaches communication courses at Carnegie Mellon’s business school, has eliminated writing assignments as homework and replaced them with in-class quizzes done on laptops in “a lockdown browser” that blocks students from leaving the quiz screen.
“To expect an 18-year-old to exercise great discipline is unreasonable,” DeJeu said. “That’s why it’s up to instructors to put up guardrails.”
___
The Associated Press’ education coverage receives financial support from multiple private foundations. AP is solely responsible for all content. Find AP’s standards for working with philanthropies, a list of supporters and funded coverage areas at AP.org.
Tools & Platforms
Vibe coding has turned senior devs into ‘AI babysitters,’ but they say it’s worth it

Carla Rover once spent 30 minutes sobbing after having to restart a project she vibe coded.
Rover has been in the industry for 15 years, mainly working as a web developer. She’s now building a startup, alongside her son, that creates custom machine learning models for marketplaces.
She called vibe coding a beautiful, endless cocktail napkin on which one can perpetually sketch ideas. But dealing with AI-generated code that one hopes to use in production can be “worse than babysitting,” she said, as these AI models can mess up work in ways that are hard to predict.
She had turned to AI coding in a need for speed with her startup, as is the promise of AI tools.
“Because I needed to be quick and impressive, I took a shortcut and did not scan those files after the automated review,” she said. “When I did do it manually, I found so much wrong. When I used a third-party tool, I found more. And I learned my lesson.”
She and her son wound up restarting their whole project — hence the tears. “I handed it off like the copilot was an employee,” she said. “It isn’t.”
Rover is like many experienced programmers turning to AI for coding help. But such programmers are also finding themselves acting like AI babysitters — rewriting and fact-checking the code the AI spits out.
Techcrunch event
San Francisco
|
October 27-29, 2025
A recent report by content delivery platform company Fastly found that at least 95% of the nearly 800 developers it surveyed said they spend extra time fixing AI-generated code, with the load of such verification falling most heavily on the shoulders of senior developers.
These experienced coders have discovered issues with AI-generated code ranging from hallucinating package names to deleting important information and security risks. Left unchecked, AI code can leave a product far more buggy than what humans would produce.
Working with AI-generated code has become such a problem that it’s given rise to a new corporate coding job known as “vibe code cleanup specialist.”
TechCrunch spoke to experienced coders about their time using AI-generated code about what they see as the future of vibe coding. Thoughts varied, but one thing remained certain: The technology still has a long way to go.
“Using a coding co-pilot is kind of like giving a coffee pot to a smart six-year-old and saying, ‘Please take this into the dining room and pour coffee for the family,’” Rover said.
Can they do it? Possibly. Could they fail? Definitely. And most likely, if they do fail, they aren’t going to tell you. “It doesn’t make the kid less clever,” she continued. “It just means you can’t delegate [a task] like that completely.”
“You’re absolutely right!”
Feridoon Malekzadeh also compared vibe coding to a child.
He’s worked in the industry for more than 20 years, holding various roles in product development, software, and design. He’s building his own startup and heavily using vibe-coding platform Lovable, he said. For fun, he also vibe codes apps like one that generates Gen Alpha slang for Boomers.
He likes that he’s able to work alone on projects, saving time and money, but agrees that vibe coding is not like hiring an intern or a junior coder. Instead, vibe coding is akin to “hiring your stubborn, insolent teenager to help you do something,” he told TechCrunch.
“You have to ask them 15 times to do something,” he said. “In the end, they do some of what you asked, some stuff you didn’t ask for, and they break a bunch of things along the way.”
Malekzadeh estimates he spends around 50% of his time writing requirements, 10% to 20% of his time on vibe coding, and 30% to 40% of his time on vibe fixing — remedying the bugs and “unnecessary script” created by AI-written code.
He also doesn’t think vibe coding is the best at systems thinking — the process of seeing how a complex problem could impact an overall result. AI-generated code, he said, tries to solve more surface-level problems.
“If you’re creating a feature that should be broadly available in your product, a good engineer would create that once and make it available everywhere that it’s needed,” Malekzadeh said. “Vibe coding will create something five different times, five different ways, if it’s needed in five different places. It leads to a lot of confusion, not only for the user, but for the model.”
Meanwhile, Rover finds that AI “runs into a wall” when data conflicts with what it was hard-coded to do. “It can offer misleading advice, leave out key elements that are vital, or insert itself into a thought pathway you’re developing,” she said.
She also found that rather than admit to making errors, it will manufacture results.
She shared another example with TechCrunch, where she questioned the results an AI model initially gave her. The model started to give a detailed explanation pretending it used the data she uploaded. Only when she called it out did the AI model confess.
“It freaked me out because it sounded like a toxic co-worker,” she said.

On top of this, there are the security concerns.
Austin Spires is the senior director of developer enablement at Fastly and has been coding since the early 2000s.
He’s found through his own experience — along with chatting with customers — that vibe code likes to build what is quick rather than what is “right.” This may introduce vulnerabilities to the code of the kind that very new programmers tend to make, he said.
“What often happens is the engineer needs to review the code, correct the agent, and tell the agent that they made a mistake,” Spires told TechCrunch. “This pattern is why we’ve seen the trope of ‘you’re absolutely right’ appear over social media.”
He’s referring to how AI models, like Anthropic Claude, tend to respond “you’re absolutely right” when called out on their mistakes.
Mike Arrowsmith, the chief technology officer at the IT management software company NinjaOne, has been in software engineering and security for around 20 years. He said that vibe coding is creating a new generation of IT and security blind spots to which young startups in particular are susceptible.
“Vibe coding often bypasses the rigorous review processes that are foundational to traditional coding and crucial to catching vulnerabilities,” he told TechCrunch.
NinjaOne, he said, counters this by encouraging “safe vibe coding,” where approved AI tools have access controls, along with mandatory peer review and, of course, security scanning.
The new normal
While nearly everyone we spoke to agrees that AI-generated code and vibe-coding platforms are useful in many situations — like mocking up ideas — they all agree that human review is essential before building a business on it.
“That cocktail napkin is not a business model,” Rover said. “You have to balance the ease with insight.”
But for all the lamenting on its errors, vibe coding has changed the present and the future of the job.
Rover said vibe coding helped her tremendously in crafting a better user interface. Malekzadeh simply said that, despite the time he spends fixing code, he still gets more done with AI coders than without them.
“‘Every technology carries its own negativity, which is invented at the same time as technical progress,” Malekzadeh said, quoting the French theorist Paul Virilio, who spoke about inventing the shipwreck along with the ship.
The pros far outweigh the cons.
The Fastly survey found that senior developers were twice as likely to put AI-generated code into production compared to junior developers, saying that the technology helped them work faster.
Vibe coding is also part of Spires’ coding routine. He uses AI coding agents on several platforms for both front-end and back-end personal projects. He called the technology a mixed experience but said it’s good in helping with prototyping, building out boilerplate, or scaffolding out a test; it removes menial tasks so that engineers can focus on building, shipping, and scaling products.
It seems the extra hours spent combing through the vibe weeds will simply become a tolerated tax on using the innovation.
Elvis Kimara, a young engineer, is learning that now. He just graduated with a master’s in AI and is building an AI-powered marketplace.
Like many coders, he said vibe coding has made his job harder and has often found vibe coding a joyless experience.
“There’s no more dopamine from solving a problem by myself. The AI just figures it out,” he said. At one of his last jobs, he said senior developers didn’t look to help young coders as much — some not understanding new vibe-coding models, while others delegated mentorship tasks to said AI models.
But, he said, “the pros far outweigh the cons,” and he’s prepared to pay the innovation tax.
“We won’t just be writing code; we’ll be guiding AI systems, taking accountability when things break, and acting more like consultants to machines,” Kimara said of the new normal for which he’s preparing.
“Even as I grow into a senior role, I’ll keep using it,” he continued. “It’s been a real accelerator for me. I make sure I review every line of AI-generated code so I learn even faster from it.”
Over the past five years, the IDF has been working to transform itself into a network-enabled combat machine, with AI and Big Data enabling the flow of information across units and commands.

-

 Business2 weeks ago
The Guardian view on Trump and the Fed: independence is no substitute for accountability | Editorial
-
Tools & Platforms1 month ago
Building Trust in Military AI Starts with Opening the Black Box – War on the Rocks
-

 Ethics & Policy2 months ago
SDAIA Supports Saudi Arabia’s Leadership in Shaping Global AI Ethics, Policy, and Research – وكالة الأنباء السعودية
-

 Events & Conferences4 months ago
Journey to 1000 models: Scaling Instagram’s recommendation system
-

 Jobs & Careers3 months ago
Mumbai-based Perplexity Alternative Has 60k+ Users Without Funding
-

 Podcasts & Talks2 months ago
Happy 4th of July! 🎆 Made with Veo 3 in Gemini
-

 Education3 months ago
VEX Robotics launches AI-powered classroom robotics system
-

 Education2 months ago
Macron says UK and France have duty to tackle illegal migration ‘with humanity, solidarity and firmness’ – UK politics live | Politics
-

 Funding & Business3 months ago
Kayak and Expedia race to build AI travel agents that turn social posts into itineraries
-

 Podcasts & Talks2 months ago
OpenAI 🤝 @teamganassi