hCECs used in this study were obtained from primary cell cultures derived from organ-cultured human corneas. They were sourced from corneal donations for scientific purposes (Laboratory of Anatomy of the Faculty of Medicine of Saint-Étienne) or from three French eye banks (Besançon, Saint-Étienne, and Nantes). All corneas were unsuitable for transplantation because their parameters did not meet the required standards for clinical use. All experimental protocols were approved by a designated institutional and/or licensing committee and informed consent were obtained from all subjects and/or their legal guardian(s). The BiiO laboratory, authorized by the Ministry of Higher Education, Research, and Innovation of France (Ministère de l’Enseignement Supérieur, de la Recherche et de l’Innovation, MESRI) under the number DC-2023-5458, conducted this research on these human corneas without the need for additional ethical approval. They were handled in accordance with the principles of the Declaration of Helsinki, bioethics laws, and French and European regulations regarding tissue donations.
For AI fine-tuning, we used 15 immunofluorescence-labeled images from 3 different cultures (see and S13 and data in the supplementary section). For AI segmentation and criteria validation, we used 4 other different endothelial cell cultures (listed in Table 1) which had varying quality, ranging from a culture undergoing endothelial-mesenchymal transition to an endothelial culture from a very young donor (2 years old, characterized by high ECD and excellent morphology). For the comparison of coating molecules, eight cultures from eight donors were used. The donors ages ranged from 55 to 85 years, with a mean ± standard deviation of 71 ± 11 years (sex ratio = 1 (4 males, 4 females)) and corneas were stored at 31 °C in organ culture medium (CorneaMax, Eurobio, Les Ulis, France) during 25 ± 22 days (min = 4; max = 72) before use. The initial ECD, measured within 5 days after retrieval, was 2390 ± 559 (1287–3233) cells/mm2. Donors and cultures characteristics were detailed in Table 1.
Table 1 Characteristics of donor Corneas used for cell cultures.
Cell culture media
Three different media were used: 1/The DM digestion medium consisted of Opti-MEM (11058021, Gibco, Grand Island, NY, USA) supplemented with 200 µg/mL CaCl2 (C5670, Sigma-Aldrich, St. Louis, MO, USA); 20 µg/mL ascorbic acid (A5960, Sigma-Aldrich) and 2 mg/mL collagenase A (10103586001, Roche, Basel, Switzerland). 2/The basic medium consisted of Opti-MEM supplemented with antibiotic–antimycotic (152 − 062, Gibco) at 1/200, 8% of fetal bovine serum (S-1860-500, Eurobio), 0.1% of CaCl2, 0.08% of chondroitin sulfate (034-1462, FUJIFILM Wako Pure Chemical Corporation, San Diego, CA, USA), 10 µM of SB203580 (3.8 µg/mL) (S1076, SelleckChem, Houston, TX, USA) and 1 µM of SB431542 (S1067, SelleckChem) (where SB203580 was an inhibitor of the p38 MAPK pathway and SB431542 an inhibitor of the TGF-β receptor; both involved in the limitation of EndoMT in cell culture), 20 µg/mL of ascorbic acid and 5ng/mL of Epidermal Growth Factor (EGF) (PHG0311, Gibco, Grand Island, NY, USA). 3/The medium for the initiation of primary cell culture and for cell passaging was the basic medium with the addition of a ROCK inhibitor (RI), Y-27,632 (S1049, SelleckChem) to promote cell adherence, proliferation and survival17,18,19.
Primary culture of hCECs
hCECs were cultivated using a protocol derived from the standard peel and digest method, also used by the team which selected the coating with iMatrix-511 (892012, Nippi, Incorporated, Tokyo, Japan)20. We increased the digestion time from 12 to 16 h and used a higher collagenase concentration (from 1 mg/mL to 2 mg/mL) to enhance cell dissociation, as previously described21. To isolate hCECs, DM was mechanically peeled from donor corneas, ensuring maximum peripheral coverage. The membranes were then incubated at 37 °C in a humidified 5% CO₂ atmosphere for 16 h with 0.5 mL of digestion medium in 48-well plates (3548, Corning, Kennebunk, ME, USA). After digestion, released hCECs were centrifuged at 200 g for 5 min in conical-bottom tubes (641997, Dutscher, Caplugs Evergreen, CA, USA). The cells were then seeded in 24-well plates (3524, Corning) pre-coated with iMatrix-511 according to the manufacturer’s instructions. hCECs were cultured in a humidified 5% CO2 atmosphere at 37 °C. The basic medium was changed the day after seeding and then weekly until confluence, which took about a month.
For cell passage, hCECs cultures were first rinsed in Ca2+ and Mg2+-free phosphate buffered saline (PBS) (SH30256.02, Cytiva, MA, USA), then incubated in TrypLE Select Enzyme 5X (A1217701, Gibco) for 15 min at 37 °C until cell detachment. Cells were detached mechanically by aspirating and dispensing the liquid in the well and chemically using TrypLE solution. Cells were then transferred in conical-bottom tubes containing basic medium supplemented with RI. The complete detachment of cells was confirmed using a phase-contrast microscope (CKX41, Olympus, Tokyo, Japan). Viable cells were counted using Trypan blue staining and an automatic cell counter (TC10, Bio-Rad, Hercules, CA, USA). Counting was performed twice to ensure repeatability and to calculate the average cell number. Passage followed a defined scaling ratio: P1 (1 well of a 24-well plate into 1 well of a 12-well plate), and P2 (1 well of a 12-well plate into 1 well of a 6-well plate), with subsequent passages at a 1:2 ratio. Throughout all stages, cells used for experiments were cultured on plates coated with the reference molecule, iMatrix-511 until experiment with the different molecular coatings. Cultured hCECs at passages 4 through 9 were used for these experiments. After the last cell counting, hCECs were centrifuged at 200 g for 5 min. The supernatant was removed and hCECs were resuspended in the medium previously described and seeded, this time, at 500 cells/mm² in 384-well plates (353961, Falcon, MA, USA) for experiments with the different molecular coatings.
To validate our AI image analysis method, we selected four cultures with very different phenotypes based on conventional naked-eye microscopy observations, representative of the various endothelial qualities, ranging from the poorest (non-transplantable) to the best (the desired goal, i.e. deemed suitable for clinical application), as illustrated in Fig. 1. Culture 1 underwent EndoMT. Culture 2 was typical of a double population of normal and likely senescent cells. Culture 3 and 4 both were clinically acceptable compared to the initial clinical trial9. For this step, each of the 4 cultures was cultured on plates coated with iMatrix-511 (the reference coating) in 384 wells with 16 replicates per culture.
In a second step, we used this validated AI image analysis method to evaluate 13 coating molecules on 8 different cultures. The diversity of the parameters involved, particularly the inter-donor variability and the variability associated with the coating molecules, made it impossible to subjectively discriminate by the naked eye, which justified the use of an automated analysis method. The 8 cultures were selected based on their ECD higher than 1000 cells/mm². This rather low threshold (by reference to the usual eye bank lower threshold of 2000 cells/mm2 for transplantation) was chosen because the aim of this work was to screen for conditions likely to increase final ECD.
For the screening of molecular coating, for each coating condition tested, 8 replicates were performed for each of the 8 different corneal donors (1 coating molecule, 1 donor, 8 repetitions). We selected 9 laminin isoforms (all from BioLamina, Sundbyberg, Sweden) as well as iMatrix-511 (Nippi) and 3 types of collagens (all from Sigma Aldrich) (Table 2). Laminins differed in their chain composition, tissue localization, and biological functions, making them of interest for specific applications in regenerative medicine and tissue engineering. These 13 molecules were compared to a negative control (uncoated well). The coating with the ten laminin molecules, including the control, was performed overnight at 4 °C, as recommended by the supplier, with all at 1 µg/cm² except for iMatrix-511, which was coated at 0.5 µg/cm². For the three collagen molecules, incubation time was done at 37 °C until complete drying of the well. Collagens I and IV were performed at 6 µg/cm² and collagen II at 2 µg/cm².
Table 2 Characteristics of the nine molecular coating.
Immunocytochemistry
At confluence, after approximately 3 weeks of culture, immunocytochemistry (ICC) was performed on hCECs directly in culture plates. The ICC protocol was previously described21,33. Briefly, cells were rinsed in Ca2+ and Mg2+ DPBS (SH30028.FS, Cytiva, Saint-Germain-en-Laye, France) and then fixed in pure methanol for 15 min at room temperature (RT). After three rinses, with Ca2+ and Mg2+ DPBS, cells were incubated in saturation buffer composed of 2% bovine serum albumin (A3059-100G, Sigma-Aldrich) and 2% goat serum (191356, MP Biomedicals, Irvine, CA, USA) for 30 min at 37 °C. The hCECs were incubated with the primary antibody for 1 h at 37˚C: NCAM (1:400, MAB24081, R&D Systems, Minneapolis, MN, USA). After three rinses in PBS, the highly cross-absorbed secondary antibodies (Alexa Fluor 488-conjugated goat anti-rabbit IgG (A11034, Invitrogen, Carlsbad, CA, USA)), diluted to 1/800, and DAPI diluted at 2 µg/mL in blocking buffer were incubated for one hour at 37 °C under gentle agitation. After rinsing three times, Fluoromount-G mounting medium (00-4958-02, Invitrogen) was added to each well.
Images acquisition
The samples were observed with an inverted fluorescence microscope IX81 (Olympus), equipped with CellSens Dimension software V2.3 (Olympus). Images were taken at x10 and x40 magnification at the center of each well. Images were obtained using a FITC and DAPI filters, using optimized parameters for each image (intensity of light source, exposure time, contrast, resolution) and a CMOS camera with 2024 × 2048 pixels resolution (Orcas-Flash4.0 LT+, C11440-42U30, Hamamatsu Photonics K.K., Hamamatsu city, Japan).
Endothelial cell density measurement
After staining, 8 replicate images per molecular coating were taken for each donor, to measure ECD. For this, we automated the counting of each cell nucleus (DAPI-stained) with a macro using the “Stardist” plugin (https://github.com/stardist/stardist) on Fiji Software (V2.9.0/1.53t https://fiji.sc/) using x10 magnification images34,35. The software segmented each stained nucleus and calculated the ECD according to the pixel ratio. We performed a visual inspection to ensure proper nuclear recognition and corrected any possible errors.
Cellular segmentation and morphological analysis using AI and mathematical algorithms
To characterize hCECs morphology, we developed a high-performance AI-based automatic segmentation and analysis solution for cells labeled with a lateral membrane marker (here NCAM) and a nucleus marker (DAPI). For morphological analysis, 2 images were taken per molecular coating and for each donor.
Segmentation using AI
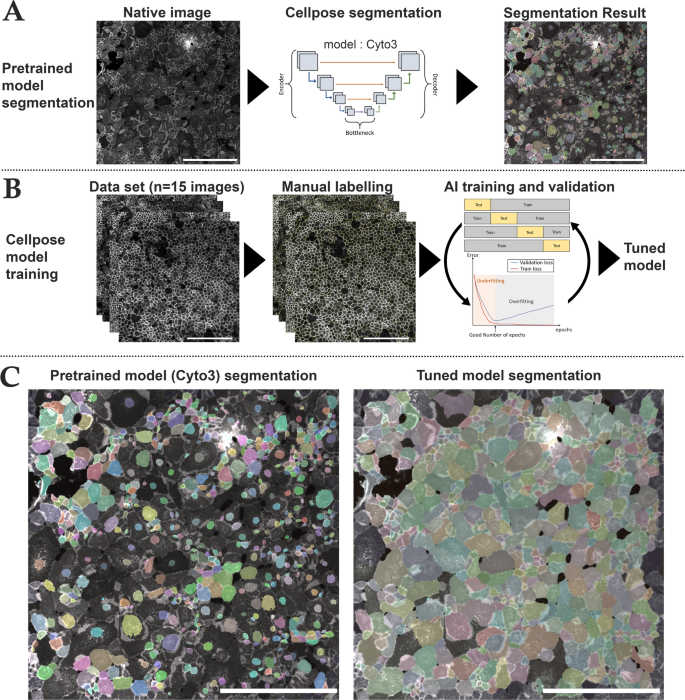
We used Cellpose, an open-source generalist deep learning algorithm for cell and nucleus segmentation (https://github.com/MouseLand/cellpose) that can be tuned for optimizing results with the users’ data (Fig. 1)36. We selected the cyto3 model because of its versatility and better efficacy than other available pretrained models37. We first verified if it was efficient with our images. We then tuned the “cyto3” Cellpose model with hCECs images labeled with NCAM and DAPI (Model in supplementary section). We manually segmented 15 images of different cell culture quality directly on the Cellpose Graphical User Interface (GUI) which allowed the extraction of the result of the segmentation on a separate image as well as the regions of interest (ROI) of each image (S13 and data in supplementary section). Manual segmentation took approximately 4–8 h per image, depending on image complexity and ECD.
We then performed a 4-fold cross-validation on the Python version of Cellpose based on the 15 manually segmented images (2048 × 2048 pixel for 1330 × 1330 μm, 16 bits) coupled with the fluorescence images (membranes and nuclei in two different image channels). Data were divided into 60% training set, 20% test set and 20% validation set, data augmentation was performed with a factor of 4 by horizontally and vertically flipping images. As there were approximately 1500 cells per image, the training set was thus constituted of around 54,000 cells. For each fold, we optimized epochs (number of training cycles the AI went through to learn/correct the weights of the model) using the validation set (800 was the best epochs per fold). Cross-validation was done by comparing manually segmented images with Cellpose segmentation using a published dissimilarity criterion and the 6 parameters described hereafter : Endothelial Cell Density (ECD), Coefficient of variation of cell area (CV), Adjusted CV, hexagonality (HEX), quality of HEX (HEX-Q) and Filimorphism38.
Fig. 1
Cell segmentation and AI training steps using Cellpose. (A) Steps for image segmentation with Cellpose which used an U-net model pre-trained on different cell types (Cyto3 model). The initial segmentation was not efficient on NCAM-labeled cultured corneal endothelial cells. Cell areas were coded by colors. (B) Steps for training a new model consisted in the selection of NCAM-labeled image of various quality (n = 15 images), followed by manual labeling and then a 4-fold cross validation training to optimize epochs and control segmentation quality of the newly trained model (tuned model). (C) Comparison of the same image segmented with the pre-trained Cyto3 model and with our tuned model. Scale bar = 500 μm on each image.
Morphometric analysis
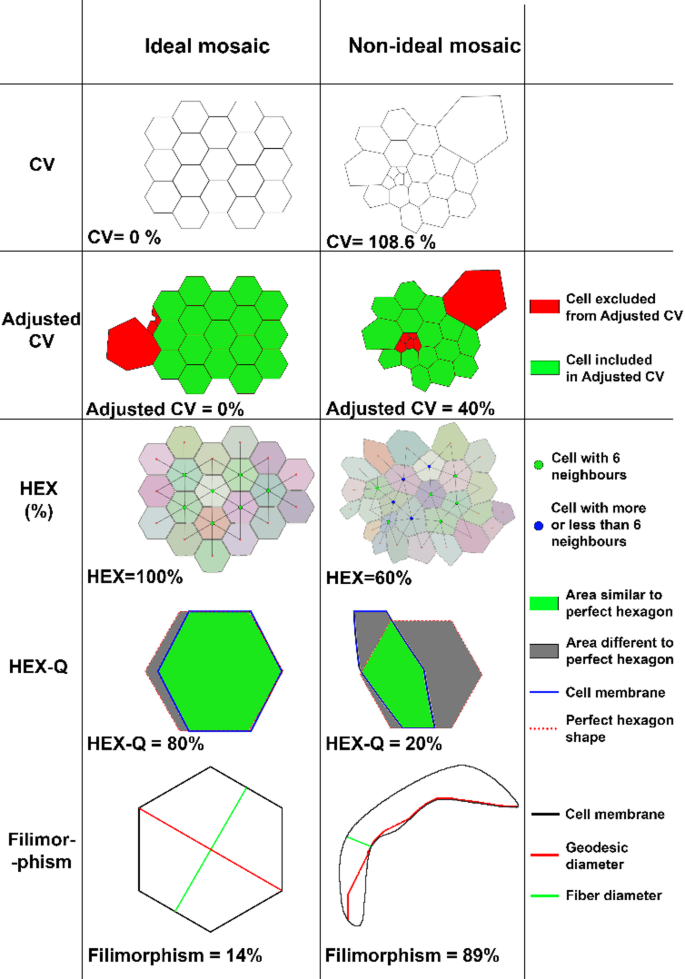
We developed a custom script in Python language (V3.11.4, https://www.python.org/downloads/release/python-3114/), interpreted with Spyder IDE (V5.4.3) to measure 5 parameters on segmented images and to conduct a comprehensive analysis of cell polymegathism and pleomorphism (Fig. 2):
Fig. 2
Parameters for quantifying hCECs morphology comparing ideal mosaic and non-ideal mosaic. CV Coefficient of variation of cell area, HEX percentage of hexagonal cells. Details for each parameter and their calculation method can be found in the supplementary methods.
1/ CV of cell area: the conventional parameter for polymegathism already mentioned. The lower the value, the more homogeneous the mosaic. It was calculated by the formula \(\:{CV}_{area}=\frac{{SD}_{area}}{{Mean}_{area}}\). The CV of a healthy endothelium ranged from 26 to 35%, depending on the patient’s age39,40,41,42,43; 2/ Adjusted CV was specifically designed for this study to assess cell cultures containing several cell populations in terms of area. This adjusted CV allowed studying the CV of the majority population within the culture by replacing the mean with the median and the standard deviation with one calculated from median absolute deviation (see Supplementary methods); 3/ HEX for polymorphism. The HEX of a healthy endothelium ranged from 45 to 70% depending on the patient’s age39,40,41,42,43; 4/ Quality of hexagonality (HEX-Q) was also specifically designed for this study: among hexagonal cells (with 6 neighbors), it measured their proximity to a perfect hexagon based on the HEXADEV criterion44. HEX-Q calculation took into account the convexity of the cell as well as the length of the sides and the angle of each side of the hexagonal cell (see Supplementary methods); 5/ Filimorphism: this parameter, specifically designed for this study assessed cell elongation by modifying the aspect ratio formula (depending on definitions, aspect ratio in the literature is calculated either 1- as the ratio between the length of the major axis and the minor axis of the cell’s fitting ellipse or 2- as the ratio between the maximal and minimal Feret diameter of a cell) adapting it even for extremely concave (U-shaped) cells (see Supplementary methods).
Establishment of endothelial quality score
To comprehensively evaluate the different parameters, a score was established, hereafter referred to as the Endothelial Quality Score (EQS). This scoring system assigned 50% weight to ECD, as it is the primary criterion used in clinical practice (eye banking), and 50% to morphology, considering that both were equally important. Morphology evaluation was based on the five parameters previously described: HEX, HEX-Q, CV, adjusted CV and filimorphism, each contributing 1/10 of the EQS. The EQS was derived from Z-scores, which were calculated by the following formula: \(\:{Z}_{i}=\:\frac{{X}_{i}-\mu\:}{\sigma\:}\:\); where \(\:{Z}_{i}\) was the score value, Xi the raw value, µ the population mean for the given criterion, and σ the standard deviation of the referred population. The higher the EQS, the better the endothelial quality.
Statistical analysis
To analyze the results of the algorithm using the AI model, the GraphPad Prism software was used. Initially, the normality of each culture for each parameter was tested using three different tests (Kolmogorov-Smirnov test, Agostino and Pearson omnibus normality test, and Shapiro-Wilk normality test). If one of these three tests indicated normality for the four cultures, a repeated Measures ANOVA followed by Bonferroni’s multiple comparison test was performed as a post-hoc analysis. If none of the normality tests showed a normal distribution, a Friedman test was used, followed by Dunn’s multiple comparison post-hoc test.
To evaluate the relationship between coating molecules and ECD or morphology, a linear mixed-effect model was used. ECD values and other positive criteria were log-transformed before the mixed effect analysis. This model accounted for both fixed effects, such as factors of interest (coating molecule), and random effects (donor, replicate ID), to account for inter-individual variations and correlations between observations. Statistical analyses were performed using R software (version 4.4.1), with the “lme4” and “lmerTest” packages to fit a linear mixed-effects model. Results were expressed as the ratios of the ECD effect relative to the reference molecule with the corresponding 95% confidence intervals.
Nvidia says ‘We never deprive American customers in order to serve the rest of the world’ — company says GAIN AI Act addresses a problem that doesn’t exist
The bill, which aimed to regulate shipments of AI GPUs to adversaries and prioritize U.S. buyers, as proposed by U.S. senators earlier this week, made quite a splash in America. To a degree, Nvidia issued a statement claiming that the U.S. was, is, and will remain its primary market, implying that no regulations are needed for the company to serve America.
“The U.S. has always been and will continue to be our largest market,” a statement sent to Tom’s Hardware reads. “We never deprive American customers in order to serve the rest of the world. In trying to solve a problem that does not exist, the proposed bill would restrict competition worldwide in any industry that uses mainstream computing chips. While it may have good intentions, this bill is just another variation of the AI Diffusion Rule and would have similar effects on American leadership and the U.S. economy.”
Earlier this week, U.S. legislators introduced the GAIN AI Act of 2025 as part of their defense policy package, aiming to restrict the export of advanced AI GPUs and prioritize access for domestic buyers. If passed into law, this measure would enforce strict export licensing conditions for AI accelerators to D:5 countries of concern (read: China), particularly targeting sales to China and nations closely aligned with it.
Indeed, according to Nvidia’s Form 10-K, sales to American companies totaled 49.9%, China accounted for 28% of the company’s sales in FY2024, whereas Singapore (which is a billing address, as Nvidia puts it) totaled 18% of the company’s sales.
The bill outlines specific technical thresholds to classify a chip as ‘advanced,’ taking a page from the Biden administration’s 2023 book when it comes to benchmarks, but making them stronger when it comes to memory bandwidth. Any GPU with a total processing performance (TPP) of 2,400 or higher, a performance density over 3.2 (TPP divided by die area), or bandwidth exceeding 1.4 TB/s (DRAM), 1.1 TB/s (interconnect), or 1.7 TB/s combined would be subject to export controls. Products exceeding a TPP of 4,800 would be outright barred from export to restricted countries, which include Nvidia’s H100 (TPP 16,000) and B300 (TPP 60,000), as well as AMD’s Instinct MI308.
In accordance with new rules, exporters (i.e., AMD and Nvidia) would need to certify that U.S. buyers were given the first opportunity to purchase, that there are no pending domestic orders, and that the export will not slow local shipments or favor foreign clients with better pricing or contract terms. Additionally, they must ensure that foreign buyers will not use the hardware to compete against American firms globally. If any of these conditions are unmet, the export license must be denied.
The new export rules would obviously apply even to older AI GPUs — assuming they are still in production, of course — like Nvidia’s HGX H20 or L2 PCIe, which still meet the defined performance thresholds set by the Biden administration. Although Nvidia has claimed that H20 shipments to China do not interfere with the domestic supply of H100, H200, or Blackwell chips, the new legislation could significantly formalize such limitations on transactions in the future.
Get Tom’s Hardware’s best news and in-depth reviews, straight to your inbox.
OpenAI has sharply raised its projected cash burn through 2029 to $115 billion, according to The Information. This marks an $80 billion increase from previous estimates, as the company ramps up spending to fuel the AI behind its ChatGPT chatbot.
The company, which has become one of the world’s biggest renters of cloud servers, projects it will burn more than $8 billion this year, about $1.5 billion higher than its earlier forecast. The surge in spending comes as OpenAI seeks to maintain its lead in the rapidly growing artificial intelligence market.
To control these soaring costs, OpenAI plans to develop its own data center server chips and facilities to power its technology.
The company is partnering with U.S. semiconductor giant Broadcom to produce its first AI chip, which will be used internally rather than made available to customers, as reported by The Information.
In addition to this initiative, OpenAI has expanded its partnership with Oracle, committing to a 4.5-gigawatt data center capacity to support its growing operations.
This is part of OpenAI’s larger plan, the Stargate initiative, which includes a $500 billion investment and is also supported by Japan’s SoftBank Group. Google Cloud has also joined the group of suppliers supporting OpenAI’s infrastructure.
OpenAI’s projected cash burn will more than double in 2024, reaching over $17 billion. It will continue to rise, with estimates of $35 billion in 2027 and $45 billion in 2028, according to The Information.
The PromptLocker malware, which was considered the world’s first ransomware created using artificial intelligence, turned out to be not a real attack at all, but a research project at New York University.
On August 26, ESET announced that detected the first sample of artificial intelligence integrated into ransomware. The program was called PromptLocker. However, as it turned out, it was not the case: researchers from the Tandon School of Engineering at New York University were responsible for creating this code.
The university explained that PromptLocker — is actually part of an experiment called Ransomware 3.0, which was conducted by a team from the Tandon School of Engineering. A representative of the school told the publication that a sample of the experimental code was uploaded to the VirusTotal platform for malware analysis. It was there that ESET specialists discovered it, mistaking it for a real threat.
According to ESET, the program used Lua scripts generated on the basis of strictly defined instructions. These scripts allowed the malware to scan the file system, analyze the contents, steal selected data, and perform encryption. At the same time, the sample did not implement destructive capabilities — a logical step, given that it was a controlled experiment.
Nevertheless, the malicious code did function. New York University confirmed that their AI-based simulation system was able to go through all four classic stages of a ransomware attack: mapping the system, identifying valuable files, stealing or encrypting data, and creating a ransomware message. Moreover, it was able to do this on various types of systems — from personal computers and corporate servers to industrial controllers.
Should you be concerned? Yes, but with an important caveat: there is a big difference between an academic proof-of-concept demonstration and a real attack carried out by malicious actors. However, such research can be a good opportunity for cybercriminals, as it shows not only the principle of operation but also the real costs of its implementation.
New York University researchers noted that the economic side of this experiment is particularly interesting. Traditional ransomware campaigns require experienced teams, custom code, and significant infrastructure investments. In the case of Ransomware 3.0, the entire attack consumed about 23 thousand AI tokens, which is only $0.70 in value if you use commercial APIs with flagship models.
Moreover, the researchers emphasized that open source AI models completely eliminate even these costs. This means that cybercriminals can do without any costs at all, getting the most favorable ratio of investment to result. And this ratio far exceeds the efficiency of any legal investment in AI development.
However, this is still only a hypothetical scenario. The research looks convincing, but it is too early to say that cybercriminals will massively integrate AI into their attacks. Perhaps we will have to wait until the cybersecurity industry can prove in practice that artificial intelligence will be the driving force behind the new wave of hacking.
The New York University research paper titled “Ransomware 3.0: Self-Composing and LLM-Orchestrated” is distributed by in the public domain.