Jobs & Careers
AI to Write Community Notes for Fact Checking on X

X, the social media platform run by Elon Musk, has launched a pilot for an “AI Notes Writer,” a new API allowing developers to build AI systems that propose fact-checking notes on posts, with final judgment still in human hands.
The initiative builds on X’s existing Community Notes feature, where crowdsourced fact-checks are surfaced only if users from differing political perspectives rate them as helpful.
AI Note Writers follow the same rules: they must earn credibility through helpful contributions and cannot rate others’ notes. Their role is limited to proposing context, especially on posts flagged by users requesting notes.
“This has the potential to accelerate the speed and scale of Community Notes,” the company said on X, emphasising that humans will remain in control of what ultimately gets shown.
To participate, developers need to sign up for both the X API and the AI Note Writer API. Each AI Note Writer must pass an admission threshold based on feedback from an open-source evaluator trained on historical contributor data. Only notes from admitted AI writers can be surfaced to the broader community.
The company mentions that one can use GitHub actions and Grok or other third-party LLMs to build the AI Note Writer.
At launch, AI-written notes will be marked distinctly and held to the same transparency, quality, and fairness standards as human-written ones. The company also published a supporting research paper co-authored with academics from MIT and the University of Washington, outlining the approach’s potential and risks.
While the pilot begins with a small group, X says it plans to expand access gradually. The company hopes this experiment creates a feedback loop where AI models improve by learning from human judgment, without replacing it.
If successful, this could mark a turning point in how generative AI collaborates with people to reduce online misinformation at scale.


NVIDIA disclosed on August 28, 2025, that two unnamed customers contributed 39% of its revenue in the July quarter, raising questions about the chipmaker’s dependence on a small group of clients.
The company posted record quarterly revenue of $46.7 billion, up 56% from a year ago, driven by insatiable demand for its data centre products.
In a filing with the U.S. Securities and Exchange Commission (SEC), NVIDIA said “Customer A” accounted for 23% of total revenue and “Customer B” for 16%. A year earlier, its top two customers made up 14% and 11% of revenue.
The concentration highlights the role of large buyers, many of whom are cloud service providers. “Large cloud service providers made up about 50% of the company’s data center revenue,” NVIDIA chief financial officer Colette Kress said on Wednesday. Data center sales represented 88% of NVIDIA’s overall revenue in the second quarter.
“We have experienced periods where we receive a significant amount of our revenue from a limited number of customers, and this trend may continue,” the company wrote in the filing.
One of the customers could possibly be Saudi Arabia’s AI firm Humain, which is building two data centers in Riyadh and Dammam, slated to open in early 2026. The company has secured approval to import 18,000 NVIDIA AI chips.
The second customer could be OpenAI or one of the major cloud providers — Microsoft, AWS, Google Cloud, or Oracle. Another possibility is xAI.
Previously, Elon Musk said xAI has 230,000 GPUs, including 30,000 GB200s, operational for training its Grok model in a supercluster called Colossus 1. Inference is handled by external cloud providers.
Musk added that Colossus 2, which will host an additional 550,000 GB200 and GB300 GPUs, will begin going online in the coming weeks. “As Jensen Huang has stated, xAI is unmatched in speed. It’s not even close,” Musk wrote in a post on X.Meanwhile, OpenAI is preparing for a major expansion. Chief Financial Officer Sarah Friar said the company plans to invest in trillion-dollar-scale data centers to meet surging demand for AI computation.
The post NVIDIA Reveals Two Customers Accounted for 39% of Quarterly Revenue appeared first on Analytics India Magazine.
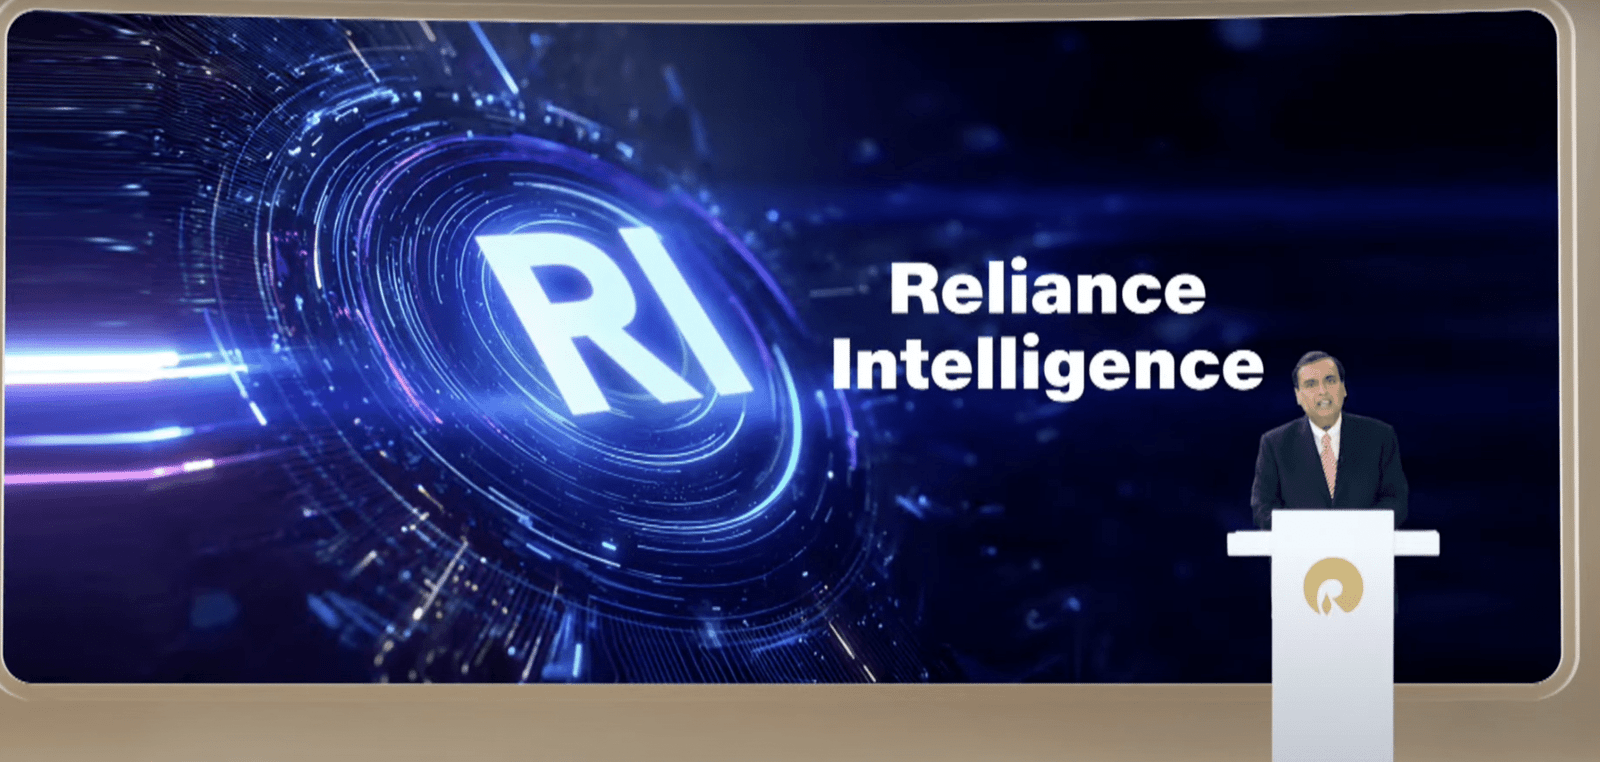
Reliance Industries chairman Mukesh Ambani has announced the launch of Reliance Intelligence, a new wholly owned subsidiary focused on artificial intelligence, marking what he described as the company’s “next transformation into a deep-tech enterprise.”
Addressing shareholders, Ambani said Reliance Intelligence had been conceived with four core missions—building gigawatt-scale AI-ready data centres powered by green energy, forging global partnerships to strengthen India’s AI ecosystem, delivering AI services for consumers and SMEs in critical sectors such as education, healthcare, and agriculture, and creating a home for world-class AI talent.
Work has already begun on gigawatt-scale AI data centres in Jamnagar, Ambani said, adding that they would be rolled out in phases in line with India’s growing needs.
These facilities, powered by Reliance’s new energy ecosystem, will be purpose-built for AI training and inference at a national scale.
Ambani also announced a “deeper, holistic partnership” with Google, aimed at accelerating AI adoption across Reliance businesses.
“We are marrying Reliance’s proven capability to build world-class assets and execute at India scale with Google’s leading cloud and AI technologies,” Ambani said.
Google CEO Sundar Pichai, in a recorded message, said the two companies would set up a new cloud region in Jamnagar dedicated to Reliance.
“It will bring world-class AI and compute from Google Cloud, powered by clean energy from Reliance and connected by Jio’s advanced network,” Pichai said.
He added that Google Cloud would remain Reliance’s largest public cloud partner, supporting mission-critical workloads and co-developing advanced AI initiatives.
Ambani further unveiled a new AI-focused joint venture with Meta.
He said the venture would combine Reliance’s domain expertise across industries with Meta’s open-source AI models and tools to deliver “sovereign, enterprise-ready AI for India.”
Meta founder and CEO Mark Zuckerberg, in his remarks, said the partnership is aimed to bring open-source AI to Indian businesses at scale.
“With Reliance’s reach and scale, we can bring this to every corner of India. This venture will become a model for how AI, and one day superintelligence, can be delivered,” Zuckerberg said.
Ambani also highlighted Reliance’s investments in AI-powered robotics, particularly humanoid robotics, which he said could transform manufacturing, supply chains and healthcare.
“Intelligent automation will create new industries, new jobs and new opportunities for India’s youth,” he told shareholders.
Calling AI an opportunity “as large, if not larger” than Reliance’s digital services push a decade ago, Ambani said Reliance Intelligence would work to deliver “AI everywhere and for every Indian.”
“We are building for the next decade with confidence and ambition,” he said, underscoring that the company’s partnerships, green infrastructure and India-first governance approach would be central to this strategy.
The post ‘Reliance Intelligence’ is Here, In Partnership with Google and Meta appeared first on Analytics India Magazine.

Cognizant has announced that it would deploy 1,000 context engineers over the next year to industrialise agentic AI across enterprises.
According to an official release, the company claimed that the move marks a “pivotal investment” in the emerging discipline of context engineering.
As part of this initiative, Cognizant said it is partnering with Workfabric AI, the company building the context engine for enterprise AI.
Cognizant’s context engineers will be powered by Workfabric AI’s ContextFabric platform, the statement said, adding that the platform transforms the organisational DNA of enterprises, how their teams work, including their workflows, data, rules, and processes, into actionable context for AI agents.Context engineering is essential to enabling AI a
-
Tools & Platforms3 weeks ago
Building Trust in Military AI Starts with Opening the Black Box – War on the Rocks
-

 Business2 days ago
The Guardian view on Trump and the Fed: independence is no substitute for accountability | Editorial
-

 Ethics & Policy1 month ago
SDAIA Supports Saudi Arabia’s Leadership in Shaping Global AI Ethics, Policy, and Research – وكالة الأنباء السعودية
-

 Events & Conferences3 months ago
Journey to 1000 models: Scaling Instagram’s recommendation system
-

 Jobs & Careers2 months ago
Mumbai-based Perplexity Alternative Has 60k+ Users Without Funding
-

 Funding & Business2 months ago
Kayak and Expedia race to build AI travel agents that turn social posts into itineraries
-

 Education2 months ago
VEX Robotics launches AI-powered classroom robotics system
-

 Podcasts & Talks2 months ago
Happy 4th of July! 🎆 Made with Veo 3 in Gemini
-

 Podcasts & Talks2 months ago
OpenAI 🤝 @teamganassi
-

 Mergers & Acquisitions2 months ago
Donald Trump suggests US government review subsidies to Elon Musk’s companies